
With the recent staff changes, it is clear that the 2017 offense will not be a simple continuation of last year. However, most of the terminology, formations and plays are known to the majority of the roster and might serve as a basis for Chip Long’s system. Given this, lets take a look back about some of the trends, tendencies of the 2016 Notre Dame playcalling.
Methodology (You can probably skip this)
I believe that I have watched last year’s offense almost certainly more (by a significant amount) than most fans. I have condensed every 2016 football game, and within that every single “offensive” snap into playlists. In under the time it would take to normally watch a single game, you can watch every single offensive snap this season.
Next, I charted about 5.5 games of the offensive snaps (I originally planned to have them all completed, but I don’t think there is a point to complete it with the hiring of Chip Long). A lot of the chart, I automated as much as possible (the method isn’t very important), but most of it I put in by hand. Some of the “fields” or columns are more useful than others: I am very confident of my identifications of formations, but “man/zone” coverage without all-22 film probably isn’t very reliable. After I charted the plays, I used sql-like “queries” to gather information quickly.
Getting into the stats
(Reminder all of the following is only 5.5 games).
Unsurprisingly, Shotgun was used 87.9% of the time, with Pistol being 9.7% and undercenter singleback being .977%.
For Personnel, I didn’t go through the trouble of analyzing each player’s number to see if they were a TE/FB/RB, etc, instead if you “aligned” as a running back I counted you as a running back, likewise a “tight end” split out is counted as a wide receiver. Personnel is defined as Backs (running or full)/Tight Ends. 11 Personnel means one back and one tight end.
The Tight Ends we had this year were much more akin to the traditional Tight End role than Kyle Rudolph and Tyler Eifert. As Ian Boyd puts it and which holds true for much of college “
Anyways, Notre Dame was in the following “personnel” groupings: 40.4% in 11, 24.1% in 10, 15.6% in 12, 13.7% in 00, 3.3% in 01, .97% in 02.
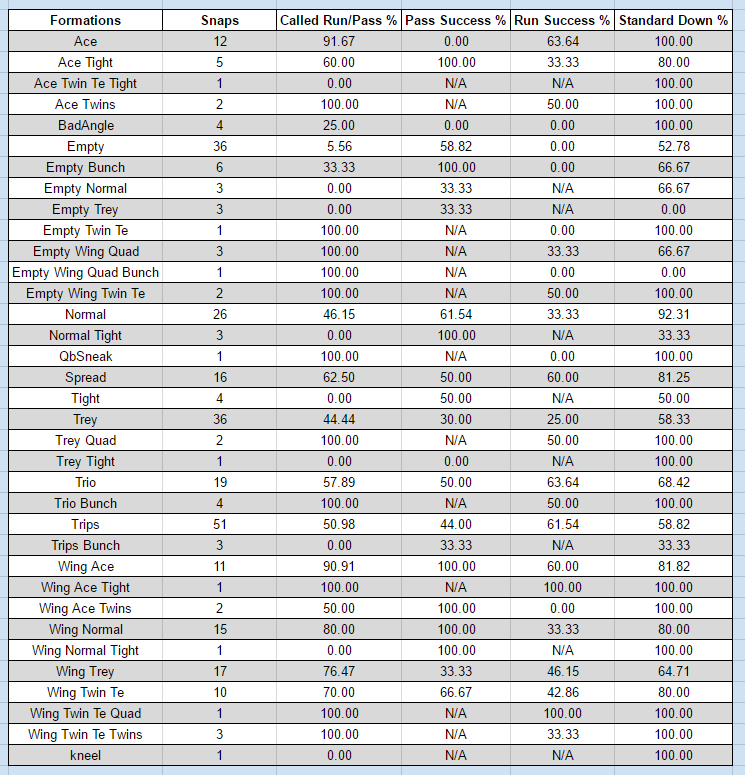
For the following I’m using “called” run/pass, such that a RPO is “called” a run (because Notre Dame largely used pre-snap RPOs, they were more of a constraint for the run) and jet sweep “passes” are runs. As you can see the most commonly used passing down formation was Empty which is five wide receivers. Normal (2×2 with an inline Tight End) was almost perfectly balanced between run and pass while Wing Normal (same formation except the Tight End is aligned as a wing) was a heavy running formation. Both of those 11 personnel formations were not very successful at running the ball.
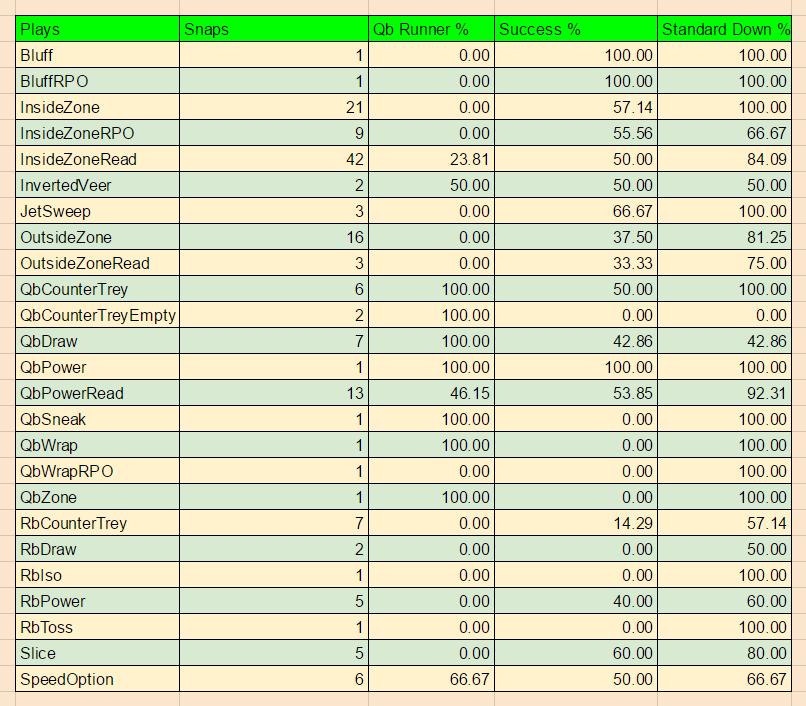
The following is a chart of “called” running plays (also included is pre-snap RPOs). Inside Zone variants were the vast majority of the running plays. All runs with a decent sample size have about the same success rate except for QbDraw which had a fantastic game or two in the beginning of the season but wasn’t very effective later on.
QbDraw is one of the most disappointing plays to me, as Kelly packaged a variety of interesting quick game concepts with it, and seemed to never throw any of them (I’m almost positive they weren’t read at all). The defense seemed to have game planned the InsideZone read for the running back to carry the ball, but often allowed Kizer to carry the ball on inverted read concepts (My listed InvertedVeer is “bash” under OSU terminology, simply inside zone with an inverted read, while QbPowerRead is power blocking with an inverted read).
By my definitions, 82.2% of the runs were “downhill”, 42% were “option” and 19.44% were “designed QB”. Additionally, 69.4% of the runs were zone and 25% were gap. This wasn’t by any stretch of the imagination a finesse horizontal running game.
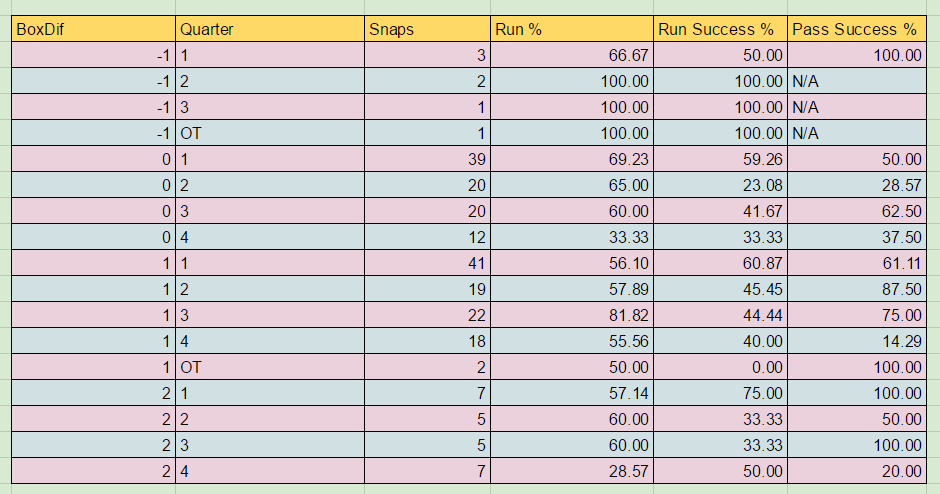
The following stats are based on standard downs standard situations (not within the last two minute of either the 2nd or 4th quarters). Box Differential represents how many more defenders in the box there is than the offense can block. A box differential of 0 means that the offense can block every box defender, while a box differential of 1 means that the offense has to utilize the quarterback to maintain favorable numbers. Except for the 4th quarter Notre Dame was either run-heavy on standard downs or “balanced” depending on your definition of the word. However, the second quarter was pretty much a black hole success wise.
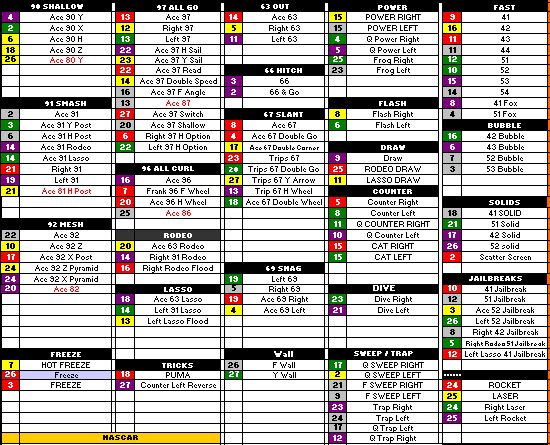
As has been demonstrated, Notre Dame was a “balanced” (on standard downs) offense predicated on a downhill running game. The following is a collection of resources from last season: my charting, cutup offense, inverted veer concepts cutups, an interesting screen series of plays ran versus Miami, cutups of RPOs, speed option concept cutups, middle screens, split zone concepts, counter trey concepts, jet sweep tap pass, and Qb draw.
As always, you can follow 18stripes on twitter and me here.

This is really impressive. Good job.
Very nice work, DITB.
Good lord man, that’s a lot of work.
Any theories on why the offense started to crater after the first quarter of many of the games?