
When the post-game conversation centers around how high the performance ranked in the Brian Kelly era and debating the significance of a +3 turnover margin and garbage time yards, things went pretty well. Below we’ll take a look at the advanced stats from Notre Dame’s wire-to-wire win over Michigan State.
The basics
The “First Take”-style debate this week after routing Sparty is wondering exactly how impressive of a win this is. I’ve seen Saturday’s game called the best performance in the BK era since 2012 Oklahoma, and I’ve seen critics point out that Notre Dame was out-gained and it would have been a close game if not for turnovers. As usual reality is somewhere in the middle.
Even using a definition of garbage time that errs on the conservative side, 39% of plays this week took place in garbage time (after Notre Dame went up 35-10 early in the 3rd quarter). Below I’ll separate out the trash, and explore all the enjoyable parts of a great win as well as the existing areas for improvement.
Explosiveness
Here’s the argument in favor of describing the win in East Lansing as “dominant”:
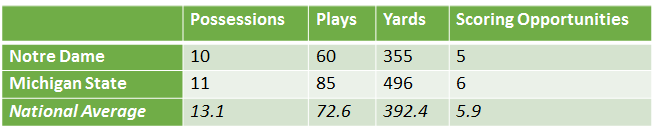
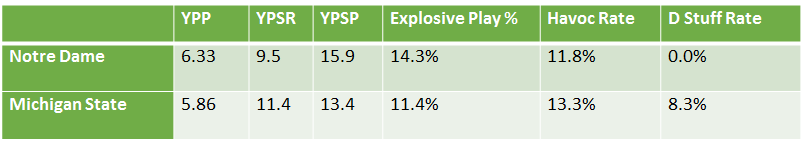
- The Irish out-gained Sparty by a decent but not spectacular .47 yards per play before garbage time. Michigan State gained a whopping 220 yards in garbage time that were meaningless and probably even lowered their win probability because of how slowly they moved in those possessions.
- Notre Dame scored touchdowns on four of its first seven possessions, and that doesn’t include Julian Love’s spectacular pick-six. With a healthy lead and the defense playing well, Chip Long eased way off the accelerator late, only attempting three passes over the last 22 minutes and 46 seconds of game time.
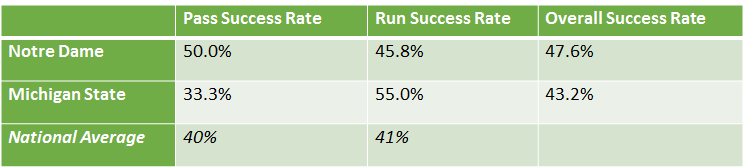
- Giving up 340 yards passing seems like a bad day for Mike Elko’s defense. But before garbage time Brian Lewerke and company averaged just 4.8 yards per pass play, with a success rate of 33%. Against a defense of mostly second stringers in garbage time, Lewerke went all Blake Bortles and threw for 6.8 yards per pass and a success rate of 57%.
Pretty compelling, right? Game situation quickly dictated that the Irish didn’t need to get too fancy offensively, and the garbage time stats skewed the final box scores significantly.
This was not the most explosive performance of the season for the ND offense, but it still featured some strong runs and deeper passes completed in the limited snaps before garbage time. After averaging only 12 yards per successful pass against Boston College, it’s extremely encouraging to see Brandon Wimbush connecting on medium and long throws downfield to an assortment of his tall receivers. Chase Claypool looked very good on each of his receptions, taking advantage of some soft coverage and falling forward for first downs or close on a couple of screen passes.
Then in the second half, the sophomore announced the beginning of his competition with Vince Carter for the “Air Canada” title with a gorgeous leaping grab and toe-touch on the sideline. For all the fretting last week about Wimbush’s accuracy and receivers’ ability to get open, passing explosiveness (IsoPPP) ranks 45th in FBS. Kevin Stepherson and his 18.5 yards per catch return this week, and I think the deep passing game is going to be quite all right.
Efficiency
If there’s nits to pick about this win, a key area for improvement was the Irish run defense. Against a run-first team with a mediocre offensive line, the Irish defense still let up a very healthy rushing success rate to the Spartans. MSU averaged 4.8 yards per rush on first down, staying on or ahead of schedule when they weren’t turning the ball over. Michigan State entered the game with a poor stuff rate (% of runs for no gain or a loss) and I expected to see the Notre Dame defense racking up several tackles for a loss, but they didn’t register a single stuff before garbage time.
It all works out when you force three turnovers though, and man is it fantastic to see an aggressive and opportunistic Notre Dame defense for the first time in years. If you’ve been waiting for the “well, they didn’t exactly kill them” angle to be defended, here it is: in an average game with a YPP differential around 0.5, that’s historically characteristic of a one-score game. Bill Connelly’s adjusted scoring margin measures how a team would have performed given an average number of breaks and turnovers. Saturday’s 20-points win had an adjusted scoring margin of just 8.4 points. Still, there’s nothing wrong with ruthlessly capitalizing on an opponent’s mistakes, you’d just rather see the turnovers combined with a dominant edge in yards per play and success rate too for icing on the cake.
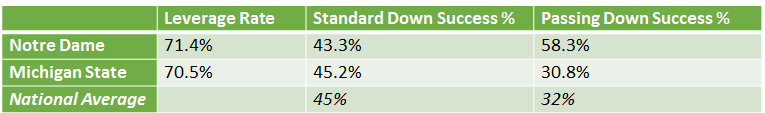
The most promising development on Saturday was that Wimbush wasn’t just efficient and explosive, he was excellent on passing downs when the defense knew throws were coming. Notre Dame entered the game ranked 120th in FBS in passing down success rate, and then converted a spectacular 58.3% of its passing downs against a solid opponent on the road. Last week I thought the Irish may start running the ball even more on passing downs if Wimbush continued the struggle, but if the passing game continues to improve Chip Long will have a full arsenal of tricks to keep defenses guessing.
On the other side of the ball, the defense continues to look like sharks sensing blood in the water on passing downs. Opponents have found success on just 21.5% of passing downs (17th nationally), and they’ve been equally stingy limiting efficiency on the ground (19th) and air (16th). When you listen to defensive players talk in press conferences, you can tell there’s a world of different under Elko in their confidence they’ll know how opponents want to do and have the right calls in place to stop them.
Finishing Scoring Opportunities, Field Position, & Turnovers
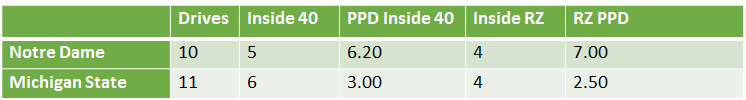
Through the first trimester, the Irish have been dominant in the red zone on both sides of the ball. Notre Dame is averaging 5.48 points (13th nationally) per scoring opportunity (a scoring opportunity is any drive that at some point reaches a first down inside the opponent 40) and allowing opponents to just 3.36 points per opportunity (18th). Focus in even more narrowly on points per red zone trip (the best stat for red zone performance, in my humble estimation) and the Irish rank 4th with 6.58 points per visit and are the highest-ranking power five team. Small sample sizes, but that’s a huge edge if Notre Dame can sustain anything close to that scoring advantage when the field shrinks.
The bad news is that Notre Dame continues to struggle in the field position battle. Tyler Newsome is exempt from this lecture, as in net punting the team is ranked 22nd, but everything else is not great. The Irish are 111th in average kickoff return given up (with another kickoff out of bounds Saturday), and tied for 123rd in punt return average (.22 yards per return!). The punt returns don’t really concern me with this offense, but kick coverage has been bad and there’s no reason for it to be so poor. These are first-world problems at this point, but in a game against USC or Stanford where every yard (hopefully) counts, it may begin to matter more if Notre Dame remains ranked in the 90-100 range in average offensive and defensive starting field position.
The turnover battle/massacre was an huge part of the win, and I don’t have much to add except it’s nice to see the Irish getting a little bit of turnover luck going their way along with the increase in opportunities. The stats consensus is that forcing turnover opportunities via pass deflections or fumbles is a skill that can be a sustained, and early returns are that Elko’s defenses will be much better than Van Gorder’s at creating those opportunities. Beyond that, there’s also turnover luck, which is unlikely to replicate itself – how often do you recover fumbles, or do pass deflections end up in your lap? These ebb and flow year to year – sometimes you’ll recover much more than 50% of available fumbles, or intercept a far higher rate of deflected passes. In 2015 and 2016 the Irish had poor turnover luck (-2.2 and -1.96 points per game, respectively), but now early in 2017 Notre Dame has benefitted from 2.9 points of turnover luck per game.
On to Miami (the closer one)
Having watched a lot of Redhawk football this year – okay, I won’t fake it, I’ve watched zero Miami games maybe ever. You may remember from last season that Chuck Martin’s team started 0-6, then rallied to win six straight games and almost knocked off Mississippi State in their bowl appearance. While that was a major step forward, particularly in the second half, the Redhawks finished just 98th in S&P+, and now rate 75th early in the 2017 rankings. Here’s a few areas to watch on Saturday in a contest that should be drama-free:
#1 Notre Dame havoc rate
After weeks of solid defensive performances, I’m now getting greedy – this is a week for the defense to dominate. Miami is 103rd in Offensive S&P+, and is neither particularly explosive (99thin IsoPPP) or efficient (80th in overall success rate). Gus Ragland will be the most experienced passer the Irish will have faced so far, but he’s only averaged 6.5 YPA against weak competition. His offensive line hasn’t helped at all, giving up sacks on 7.5% of standard down passes (103rd). They haven’t blocked well in the run game either, with an opportunity rate in triple digits (109th) nationally. Early on I’d like to see Elko get aggressive and wreak some havoc with the first team in, then hopefully give way to some garbage time snaps to build depth.
#2 Miami passing success rate
The Redhawks are the first team this Irish team will face that leans a little bit more toward the pass (81st in standard down run rate), and have a dangerous receiver in junior James Gardner. While he hasn’t been overly relied on, Gardner is averaging 18.4 yards per catch and at 6’4 will have a size edge on the Notre Dame secondary. The Irish have been solid against the pass without too threatening of challengers, and while I don’t think they’ll write poems about Ragland to Gardner, I hope to see the Irish disrupting the pass game and getting their hands on one or two throws. The Notre Dame secondary has rarely been caught out of position this year, but has gotten beat by bigger athletes on a few jump balls, so I’ll be watching for improvement in those 50/50 opportunities.
#3 Notre Dame rushing success rate
The strength of Miami’s defense so far has been defending the run, where they’ve given up only 3.52 yards per carry. They’ve been strong limiting efficiency and explosiveness, without a run of over 30 yards given up through four games. As you might have guessed, the quality of competition so far has been somewhere in the bakery aisle between creampuffs and cupcakes. The most talented offense they’ve faced is Cincinnati, who rushed for 4.58 yards per carry against the Redhawks but only 4.58 against 3.8 against Navy. I’m not sure the Redhawk defense can offer much resistance against the Irish rushing attack, but it’ll be a good opportunity for the running backs behind Josh Adams to get more reps.


I have an NDMSPaint request…please, we need a Brian Win-Bush picture.
Clearwall, I posted this in the MSU recap, but was very interested in your thoughts given your background. Coincidence?
So, the goofballs at ND nation are good for something. Someone there posted something that I was curious about but did not have a chance to look into – the officials who missed the helmet to helmet/ targeting hit on Brandon Wimbush at the MSU game on Saturday is the same crew that missed the targeting hit on Tori Hunter Jr. at the Texas game last year:
http://grfx.cstv.com/photos/schools/msu/sports/m-footbl/auto_pdf/2017-18/box_score/stats_20170924aaa.pdf
http://www.und.com/sports/m-footbl/stats/2016-2017/texas.html
(Of course, the NDN jamokes blame the hit on Brian Kelly and Jack Swarbrick, too, so some things never change.)
Man, TCU’s head coach is a really bad referee.
He used to be on the rules committee, he should know better
Probably just a coincidence. I see they were using 7-man mechanics against Texas and 8 against MSU. There is some division of labor between the R and C in 8-man so that might explain part of why they missed it this week. The hit on Hunter would have been on the B to make that one an it’s the same guy.
Did you mean MSU in the title and not Boston College???
Indeed (this is what happens when you have a template you update each week) – thanks for catching
Really glad Kelly pointed out the missed targeting on a play involving Wimbush. There were other “suspect” hits on Wimbush as well. I dont think MSU are a dirty team but like BK pointed out the guy wasnt even attempting to tackle him.
Well, after having read this, and focusing only on the points that validate my claim, I feel totally vindicated. Not dominant!