
Notre Dame played the worst team in FBS per the latest SP+ rankings, and dominated as expected with season-high advantages in explosiveness and efficiency. Where can the Irish continue to improve, what were the most impressive stats from the blowout win, and what challenges USC brings to South Bend next week.
Per SP+ garbage time beings with a lead of 38+ in the 2nd quarter and 28+ in the 3rd quarter, so halftime of this game marks where garbage time began. By this definition 41% of plays were garbage time – efficiency and explosiveness numbers remove these plays. Finishing drives, field position, havoc rates, and turnover numbers include all drives.
Explosiveness
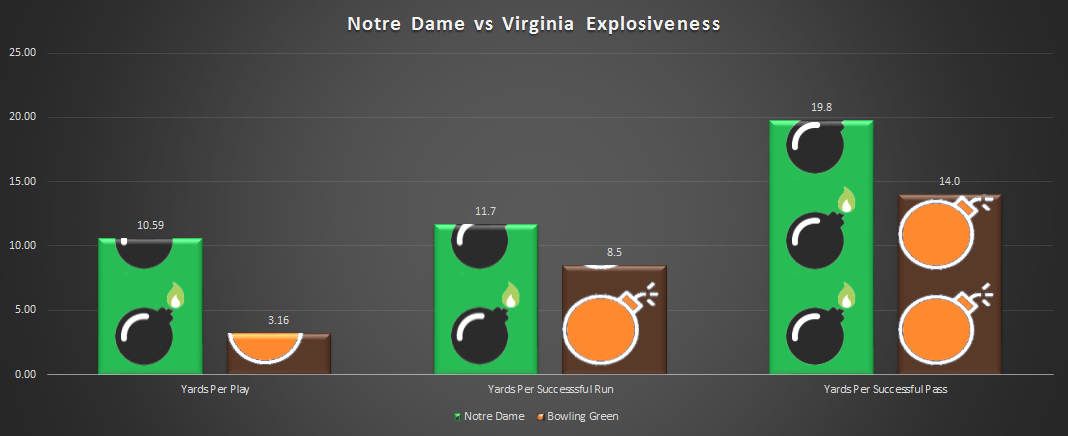
The Irish out-gained the Falcons by 7.43 yards per play in the first half before easing off the accelerator in the second half, where the home team still held at +4.98 YPP advantage. Breaking those numbers down further, Notre Dame held a slight advantage in the run game, averaging 5.6 yards per rush versus Bowling Green’s 4.58. But through the air Ian Book put up 7-on-7 numbers – 15 yards per pass attempt! – and the BGSU QB rotation averaged 1.37. When the Falcons passed on passing downs – which is what you usually have to do to be successful, hence the name – those ten attempts produced -10 yards.
After a three and out on the first drive, Book and the collection of superior skill position players for the Irish asserted their superiority, gaining 10+ yards on 13 of 43 first half plays, with 8 of 20+. The gameplan to spread touches around early and often was evident, with eight different players tallying at least one of those ten yard gains (McKinley (3), Jones (2), Kmet (2), Claypool (2), Tremble, Smith, Wright, and Finke). Again, this was just in the first half!
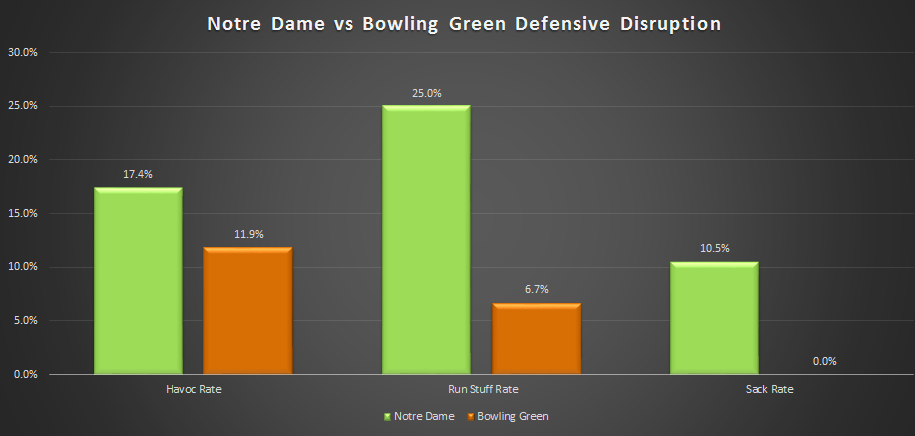
The Notre Dame defense will see its havoc rate for the season dip a bit despite constantly harassing Bowling Green quarterbacks and posting an impressive run stuff rate. This is in part why havoc rate is a descriptive rather than predictive stat that goes into SP+. By nature the disruption in havoc makes an opponent inefficient – if a play ends in a TFL, forced fumble, or pass break-up, it’s usually a failure. But the lack of disruption that shows up in the box score (for example, QB hits or pressures aren’t included) doesn’t mean that the defense isn’t effectively limiting opponents.
The Irish continue to also limit opponent explosive plays, especially on the ground, where the Irish haven’t allowed a 20+yard run (excluding garbage time) since the first half of the New Mexico game. The Falcons had just three successful pass plays in 19 attempts in the first half, with just one double-digit completion (a 24 yard gain).
Efficiency
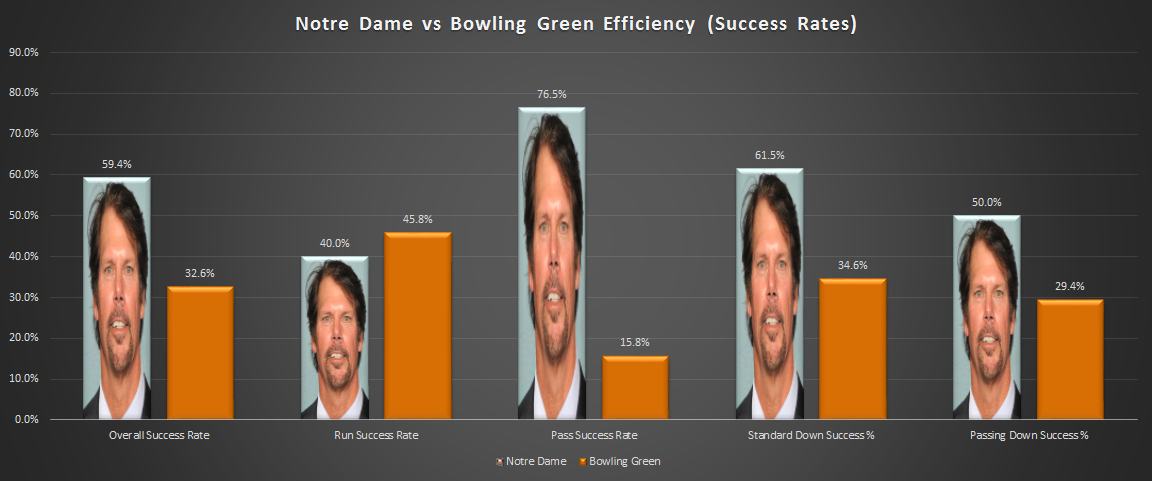
Again you can see the massive gap driven by the differences in the passing game. The rush efficiency numbers look disappointing on the surface, but come from a small sample size of 15 first half runs. The Irish were successful on their first five run attempts (excluding Book’s scramble on Notre Dame first third down), then had the following five consecutive”failures” per SP+ success rate definitions that were still productive downs:
- 3 yard Davis run on 1st and 10
- 3 yard Davis run on 2nd and 7
- 4 yard Flemister run on 1st and 10
- 4 yard Flemister run on 2nd and 6
- 4 yard Flemister run (sensing a trend?) on 1st and 10
In short, nothing to worry about, although there is good evidence (at least from NFL data) that your father’s “4 yards on first down is great, stay on schedule” wisdom isn’t exactly supported! But far better to have more productive failures than stuffs or losses.
Original motivation for this was calculating success rate (some older measures use 40% of yards needed on 1st down), but also relevant for how teams should feel about gaining/allowing 4 yards on 1st & 10 https://t.co/Zhe3qPCmH8
— new-age analytical (@benbbaldwin) October 9, 2019
And don’t look now, but with a strong end to the Virginia game and start to Bowling Green, Tony Jones Jr. is now averaging 6.9 yards per carry and a 53% success rate (national average: 41%). With Jafar Armstrong set to return next week, the running back rotation looks to be peaking heading into the two biggest remaining games of the season. And while the experience has been valuable, reducing the roles of C’bo Flemister (38% success rate, 2.5 YPC) and Jahmir Smith (50% success rate on 4.3 YPC) may be beneficial.
| Leverage Rate | Average 1st Down Gain | Average 3rd Down Distance | 3rd Down Conversion % | |
| Notre Dame | 81.3% | 11.29 | 5.83 | 66.7% |
| Bowling Green | 60.5% | 4.75 | 7.64 | 36.4% |
Similarly, the Bowling Green run success rate appears higher than expected but was never threatening. In fact, the Falcons didn’t have a successful offensive play until their 12th snap of the game, after three 3-and-outs and they already trailed 21-0. Even in garbage time the BGSU offense couldn’t do anything, with no successful plays in the entire fourth quarter. That was on just six plays, as the Irish ate up ten minutes of time with a long touchdown drive led by the Phil Jurkovec and a four minute drive ending in a kneel down.
pic.twitter.com/FetZ9COFuKa— Bill Connelly (@ESPN_BillC) October 7, 2019
Something to watch moving forward is Notre Dame’s use of tempo. After finishing 25th in SP+’s adjusted pace last season, the Irish have run the 10th fewest plays on offense per game. There’s some situational elements that help explain this – playing two cupcakes in five games, and two very slow opponents in Georgia and Virginia definitely account for a good deal. But look for Chip Long and the Irish offense to go fast in favorable matchups to try to catch opposing defenses off guard and keep the same personnel on the field against USC and Michigan.
Finishing Drives, Field Position, & Turnovers
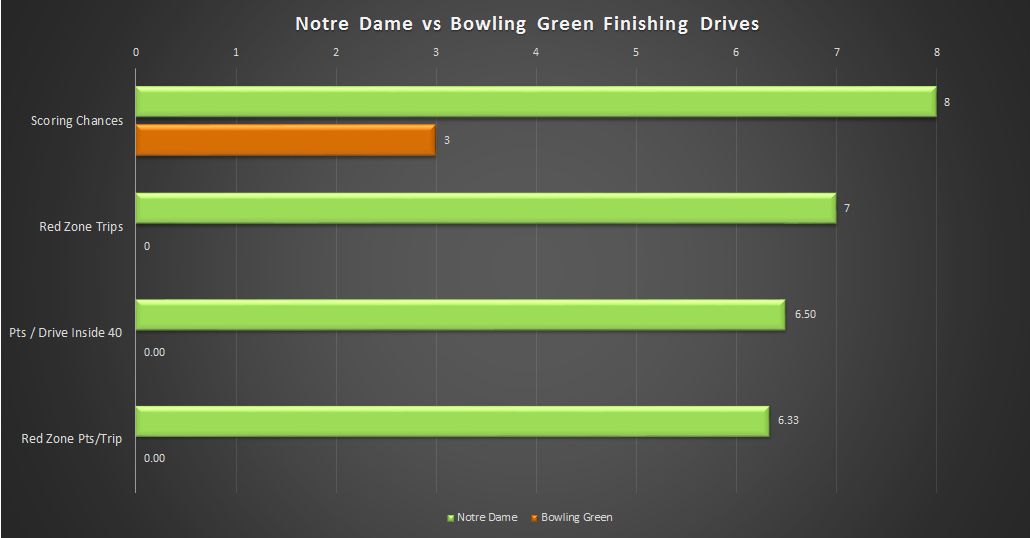
After a near-perfect day against Bowling Green the Irish have a strong argument as the best team nationally converting scoring chances. Notre Dame is tied for 1st as one of four teams to score on every red zone visit, and is first among power five teams averaging 6.4 points per red zone trip (trailing only Navy, Tulane, and App State in FBS). Three scoring chances for Bowling Green came up empty thanks the a massive sack forcing the Falcons out of field goal range and into a punt, the first half Hail Mary getting picked off, and the Julian Okwara field goal block.
The Irish held a solid advantage in average starting field position, starting possessions on average from their 29 while Bowling Green began on average at their own 21. Neither team had many short fields to work with, but Notre Dame was able to convert on offense anyway, and the Falcons best starting spot of the entire game was at their own 25.
It was a quiet game in terms of turnovers, with just the one inconsequential interception for Jalen Elliott before the half as time expired. Bowling Green had two fumbles in the game but recovered both, reducing Notre Dame’s perceived turnover luck according to the advanced stats systems.


-1.00 YPP allowed on Passing Downs is perhaps the most absurd stat I’ve seen since you’ve started doing these recaps.
that’s on passing down passes only, they had some positive runs on passing downs haha, but yes it’s ridiculous
Just watching the game now on DVR, and realizing this has little to do with the advanced stats given that this was in garbage time, but: I am very impressed with the way the team looked in the 4th quarter. I mean literally looked: our backups actually look like a D1 football team in terms of size and fluidity of movement etc. That was not the case for ND teams even fairly recently, much less last decade. Props to the coaching staff on really building out a roster.
Negative thought, because I can’t help myself: Jurk throws a very ugly ball. He looks like a very broke man’s Tim Tebow.