
Recapping Notre Dame’s narrow escape over an always irritating Navy offense – many offensive numbers that were better than they looked on film, a solid defensive effort with a few missed opportunities, and a look at Bryce Love and Stanford.
The Basics
| Possessions | Plays | Yards | Scoring Opportunities | |
| Notre Dame | 7 | 47 | 331 | 4 |
| Navy | 8 | 80 | 318 | 7 |
Ah, the familiar painful slog of playing the Midshipmen, this time with the added benefit of poor November conditions. Despite a fairly even number of possessions, the Middies ran 33 more plays than Notre Dame while playing keep away and draining time of possession as quickly as possible. The Irish had just seven real offensive possessions after taking out Chris Finke’s fumble (which took place on Navy’s only punt of the game) and the final series of kneel downs. For just the second game this season, there was no garbage time, which is easy on my spreadsheets but was hard on my heart.
Explosiveness
| YPP | YPSR | YPSP | Explosive Play % | Havoc Rate | D Stuff Rate | |
| Notre Dame | 7.04 | 9.3 | 19.9 | 19.1% | 7.5% | 9.7% |
| Navy | 3.98 | 6.2 | 13.7 | 3.8% | 6.4% | 7.1% |
Removing kneel-downs, the Irish were somehow +3.07 YPP in a game that felt like torture throughout. Navy’s ruthless efficiency minimized some of the defensive effort – Ken N takes what some coaches see as a poor yards per play output and thinks “Hey, I can still convert that if I run it four times!”. Somehow the triple option took something good – the Irish were pretty disciplined against big plays, allowing just two gains of over 15+ yards and nothing over 21 – and made it a weakness, since it allowed Navy to methodically move and attempt to wear down the defense.
Offensively, this felt like a much worse performance than the statistics bear out. The sequencing in particular was as poor as possible for this matchup, where jumping out to an early is key to throwing off Navy’s strategy. But throw it all together and in the seven offensive possessions the Irish averaged 3.43 points per drive, a number that over the course of a season would be good for 4th highest nationally.
It was another Rorschach test game for Brandon Wimbush and the Irish passing game – you could see whatever you wanted to see both from the eye test and statistics. Again, it wasn’t a very efficient game, but the explosiveness when things were clicking led to Wimbush’s second highest yards per attempt (9.1) total of the season. There were drops, poor throws, and some on the money. No one knows what Wimbush’s development this offseason will look like, but for now it seems like Chip Long will try to do his best sprinkling in perimeter passes and deep threats to keep defenses honest against the run while trying not to sacrifice too much efficiency.
Efficiency
| Run Success Rate | Pass Success Rate | Overall Success Rate | |
| Notre Dame | 53.6% | 42.1% | 48.9% |
| Navy | 50.0% | 37.5% | 48.8% |
The Irish defense also had a game that was hard to criticize or praise too much. Let’s start with the bad – Navy entered Irish scoring territory on seven of eight possessions. Mike Elko’s defense didn’t limit their efficiency too much, as the Middies were successful on half of their runs. Against the triple option you have to shut down Navy on the rare times you force them into passing downs, and the ND defense gave up conversions on 3rd/4th and 7 or more five different times.
Navy came into this game averaging 33.7 points, 369.8 rush yards per game and 5.9 per rush. Notre Dame held Navy to 17 points, 277 rush yards and 3.8 per rush. Not a bad day for the defense, not bad at all.
— Bryan Driskell (@BGI_CoachD) November 18, 2017
In the big picture, however, 17 points gets it done, and the Irish held Navy well below their usual production levels. Despite letting the Midshipmen get too many scoring chances, Notre Dame only allowed 2.43 points per trip inside the ND 40-yard line. The “bend but don’t break” defense allowed Navy to play at their preferred pace and keep possessions low, but ultimately was enough. If the Irish has performed a little better on those passing downs, this could have been one of the strongest defensive efforts against Navy in the last decade.
| Leverage Rate | Standard Down Success % | Passing Down Success % | |
| Notre Dame | 72.3% | 55.9% | 30.8% |
| Navy | 68.8% | 61.8% | 20.0% |
Returning to the offense, the Irish were efficient and didn’t allow Navy to really disrupt anything – if anything, it was Notre Dame derailing itself. Passing downs continue to be tough, and until Wimbush improves his consistency they will be for the near future. Early this year explosive runs, including many on passing downs like 2nd and 10, negated some of the efficiency issues the offense faced. But over time, whether through better defensive game planning or some wear and tear on the running backs, those explosive runs have dried up a bit.
Finishing Scoring Opportunities, Field Position, & Turnovers
| Drives | Avg. Starting FP | Inside 40 | PPD Inside 40 | Inside RZ | RZ PPD | |
| Notre Dame | 7 | ND 25 | 4 | 6.00 | 3 | 5.00 |
| Navy | 8 | NAVY 30 | 7 | 2.43 | 2 | 7.00 |
As mentioned earlier, the scoring opportunities defense saved this one. The Irish also didn’t do themselves any favors in the field position battle, with the Finke muffed punt and some subpar efforts from Tyler Newsome giving away some hidden yards. The turnover battle ended one to one, with a gift to Troy Pride offsetting Notre Dame’s earlier fumble.
On to hot takes (again)
I get it. This wasn’t a fun game to watch, and it wasn’t Notre Dame’s best performance. The “eye test”, however you’d like to look at it, saw some head-scratching plays. That’s why after this performance in S&P+ the Irish … went up one spot.
Similar to last week’s myth-busting of “Getting blown out means you’re an eternity away from championship contention”, this week’s refrain is “playing close games against inferior talent means you are bad”. And that can be true – if it’s happening routinely. But this is the first one-possession win of the year. It just happens to be over an opponent fans like to think of as some annoying, plucky underdog that shouldn’t pose a threat due to their lack of size/talent.
That’s simply an anachronistic view of today’s Navy program. The size and talent advantages are real, but the distance in those gaps is far less than it used to be. Over the last five years Navy’s average S&P+ rank is 58th – virtually tied with the best and most talented G5 teams like Houston, Memphis, and San Diego State (and ahead of a whole host of poor P5 teams). And that’s before even incorporating the schematic and physical annoyances of the triple option. Our biases may cause us to look at Navy like a game that the Irish should dominate year-in and year-out, but there’s a reason no power programs want to play Memphis, SDSU, or Houston, and it’s not helpful to downplay the fact that the modern Middies are usually a solid team.
The sequencing of the last three games makes this game feel worse than it was in reality – if this game is between, say, UNC and USC does it really register the same way? But coming off of a win over Wake Forest where you could choose to be alarmed if you really care about garbage time and an awful no-show in Miami, I can see why a lot of fans were waiting for the other shoe to drop. But it didn’t drop, and these close games happen to even championship-caliber teams. Like 2014 Ohio State, who played Navy early in the year and gave up 300 yards rushing and led by 3 points in the 4th quarter through 50+ minutes. Or last year’s title-winning Clemson team, that beat mighty Troy by six points.
We have so few games a year that it’s tempting to make each game a referendum – on the quarterback, on play-calling, the team’s ceiling, a coach – but the natural state of college football is inconsistency. Playing two close games in the first eleven (or ten, because let’s not put the one that was not close and bad in that count) is no harbinger of doom.
On to Stanford
Three things to know about the final opponent of the regular season:
Not a great defense, but better against the pass
The Cardinal rank 52nd in Defensive S&P+ and 49th in points per drive allowed. Breaking that down a bit more, they’re 76th in Rushing Defense (S&P+) and 58th in Passing Defense. This all seems good, but there’s not a “No Premature Optimism Allowed” rule in this space after Miami. The Stanford DL is not particularly disruptive – 110th in run stuff rate, 111th in opportunity rate, and 106th in rushing success rate allowed. They do a little better containing long runs, but opponents have gotten consistent positive yards on the ground.
Through the air it’s a similar story – a pretty mediocre pass rush (55th) but good big play prevention (16th in Passing IsoPPP). The Cardinal have been better rushing the passer on passing downs, but it’s been a risky proposition that’s led to poor overall numbers on passing downs (73rd in Passing Downs S&P+ and 86th in Passing Downs Success Rate allowed).
Bending But Not Breaking Keeps the Defense Working
The focus on big-play prevention has worked fairly well in propping up the areas above that are indicative of a fairly leaky defense. Stanford’s defense ranks above average in limiting opponent scoring drives (35th) and has benefitted from the best average opponent starting field position in the nation. David Shaw’s crew will force the Irish to put together long scoring drives and execute well in the red zone.
Bryce Love explosions and not much else
The Stanford offense is a picture of extremes that when you mix them all together, has led to solid results. They rank 32nd in Offensive S&P+, with a run-heavy approach but results that are pretty even between Passing S&P+ (56th) and Rushing (51st). The ground game has been boom or bust, with Bryce Love giving them the best Rushing IsoPPP mark in the nation to counteract a 39.4% rushing success rate that’s 94th. There’s been a healthy dose of negative plays, with a stuff rate allowed of 20.4% (86th), but the offensive line has been very good protecting the passer (9th in adjusted sack rate allowed).
Through the air, the efficiency/explosiveness profile gets inverted for Stanford. They’ve had a decent passing success rate (40.5%, 68th in FBS) but virtually no big plays (120th in Passing IsoPPP) with just four pass plays of 40+ yards on the year (tied for 113th). Per usual Stanford, it’s mostly big receivers and tight ends that are decent efficiency options but not burners. Notable after Christian McCaffery’s departure is the lack of passes to running backs – Love has just nine targets this season.


I liked your point about how what seems like a good strategy (consistently holding Navy to 3 yards per play), actually hurt ND because it wore down the defense by allowing Navy to dominate time of possession. Do you think a better strategy against Navy would be to gamble a bit more on D with more blitzes to trigger a big loss (and hopefully leading to more punts)? Or do you think the Elko plan was good, and it was on the offense to score more often (and not punt)?
This is my question every year as well. Should we be taking way more chances against Navy? The big concern is that when you gamble against an option team, one missed assignment can lead to a 50 yard gain. It’s such a difficult trade-off. And I suppose if Finke doesn’t fumble that punt, there’s a decent chance we’re not even talking about this, and instead talking about how we finally handled Navy fairly easily in a boring game.
I agree with you, I think the defense was more or less fine. Frustrating to not get off the field, but that’s a function of Navy’s style and it’s not too difficult to gain 3-4 yards a pop on option plays. I’d rather do what they did rather than get too over-aggressive and then burnt for a big gain.
I’d combat it by being more aggressive on 4th down. ND punted on a 4th&5 at Navy 44. I would have gone for that. Maybe be bullish and even go for 4+2 on the first drive at the ND 36. That’s bold but you have to know that if Navy gets their way, you’re getting very few possessions. Might as well maximize them.
Also in full agreement the fumbled punt extended the competitiveness of the game. It was the first quarter and a 3-3 game but it shifted momentum, Navy kept the defense on the field and scored to make it 10-3. If ND gets the ball back and scores (as they did the next time offense got ball) it’s 10-3 the other way by end of the 1st and starting to tip a little into control mode. Instead, down 10-3 it was scramble mode.
The 4th & 5 was frustrating. I would agree that in 90% of circumstances against Navy, if you cross the 50 you shouldn’t be punting. Honestly, I’m not sure there’s a ton of value in kicking field goals against them either, especially if you have 4th and short early in the game.
I agree. I think ND could consider every series “4 down territory” once it gets into Navy territory and would likely score a TD 80-90% of the time. OK, I’m just pulling stats out of thin air, but I think it’s true here.
It wasn’t just the fumbled put that hurt us, it was the very poor start and ND’s first two series. If we could have scored on one of those and not fumbled the punt, it would have put Navy in a big bind and they would have been forced to gamble more.
As for Stanford, you describe them as bend-but-don’t-break (prevent the big play). However, with Wimbush’s completion %, do you expect them to bring an extra man into the box to stop the run, and then dare Wimbush to beat them through the air?
I think that has to be the move, maybe even morso with the receivers banged up. They will pick their spots and may wait to see how Wimbush and their DL are looking in the matchup, but they may take their chances with their secondary one on one a bit more than usual m
Is Love even going to play? If he does, how effective will he be? Listened to the HLS pod last night and they mentioned he looked really banged up coming off the field from Cal.
I watched most of that game for some reason; he looks to be hurting more than Adams, and it seemed like Adams was getting up slowly after every carry. But it’s David Shaw, so I expect him to absolutely run Love into the ground. He might be less effective, but I bet Shaw still finds a way to get him 20 touches.
I just read an article that said Love didn’t play the last 11:43 of the game, helped off the field, medical tent, treatment after the game. He’s clearly hurting.
Yet before that point, he also got his ankle re-taped during the game and then had enough juice to break a 57-yard touchdown. I’d be surprised if he gets 20 touches (unless he heals up a lot in this week) but he’s definitely going to get some and he’s shown still explosive enough while not 100% to break a huge play or two open.
Sounds like last week was a race against the clock to see if he could bust a huge play before getting too injured to continue. Worked out well for them. Ideally this week the defense can contain him until he’s too banged up to continue.
Yeah, hopefully we can bottle him up enough in the first half and he’s too worn out to play in the second and we can really turn it on there.
With regards to the view that ND should never play a competitive game with or let alone lose to Navy, I listened to the ISD Power Hour pod today and had to continually roll my eyes as Mike Frank and Bob Chmiel kept saying that ND should never lose to Navy. I just don’t understand how these older school guys have not been able to change their perspective on the Navy program. We have mountains of evidence, both traditional and advanced stats/results, that show Navy is pretty damn good.
That being said, I’m glad Jamie is there to provide some semblance of reality to the show.
I used to really like that podcast, but have tired of it lately. There does not seem to be any grey areas to their viewpoints. It’s either – “Kelly can’t coach, the team doesn’t listen to him, the team “looks” uninspired, they can’t get up for a game,” after they lose, or the team is “great, unstoppable, best team ever, Kelly finally knows what he is doing” after a win. It’s all touchy-feely emotional stuff without any hard facts to back it up. Jamie does a good job of that on his own, but on the podcast seems to just go along with what Mike says.
While many think he’s a “homer” and too optimistic, I think Bryan Driskell and Lou Somogyi’s podcast is much better, mainly because Driskell actually goes back and rewatches the game several times and grades each of the players. (Plus, the folks at ND Nation hate both Bryan and Lou, so that has to count for something!)
I’ll have to check Bryan and Lou’s podcast out. I agree with the touchy-feely sentiment. It makes me cringe every time Mike says the players either have or don’t have “want to.” Players who get to this level are competitive individuals. I pretty much assume they all hate to get beat on any particular play.
Congrats to Eric, the Rigneys, et al. for continuing to get under ACross’ thin skin. He always takes whatever bait is offered. You are doing God’s work, gentlemen.
Just now watching the game because Life. A few thoughts:
1. Wimbush was seriously rattled after hanging ESB out to dry – two halfhearted keepers and the shortest incomplete pass ever to Mack. In hindsight, maybe that was the play of the game because of the confidence shift.
2. Love the uniforms, mostly because we wore something different that wasn’t gaudy. Have you seen the new Nike NBA uniforms? Buy stock in UA.
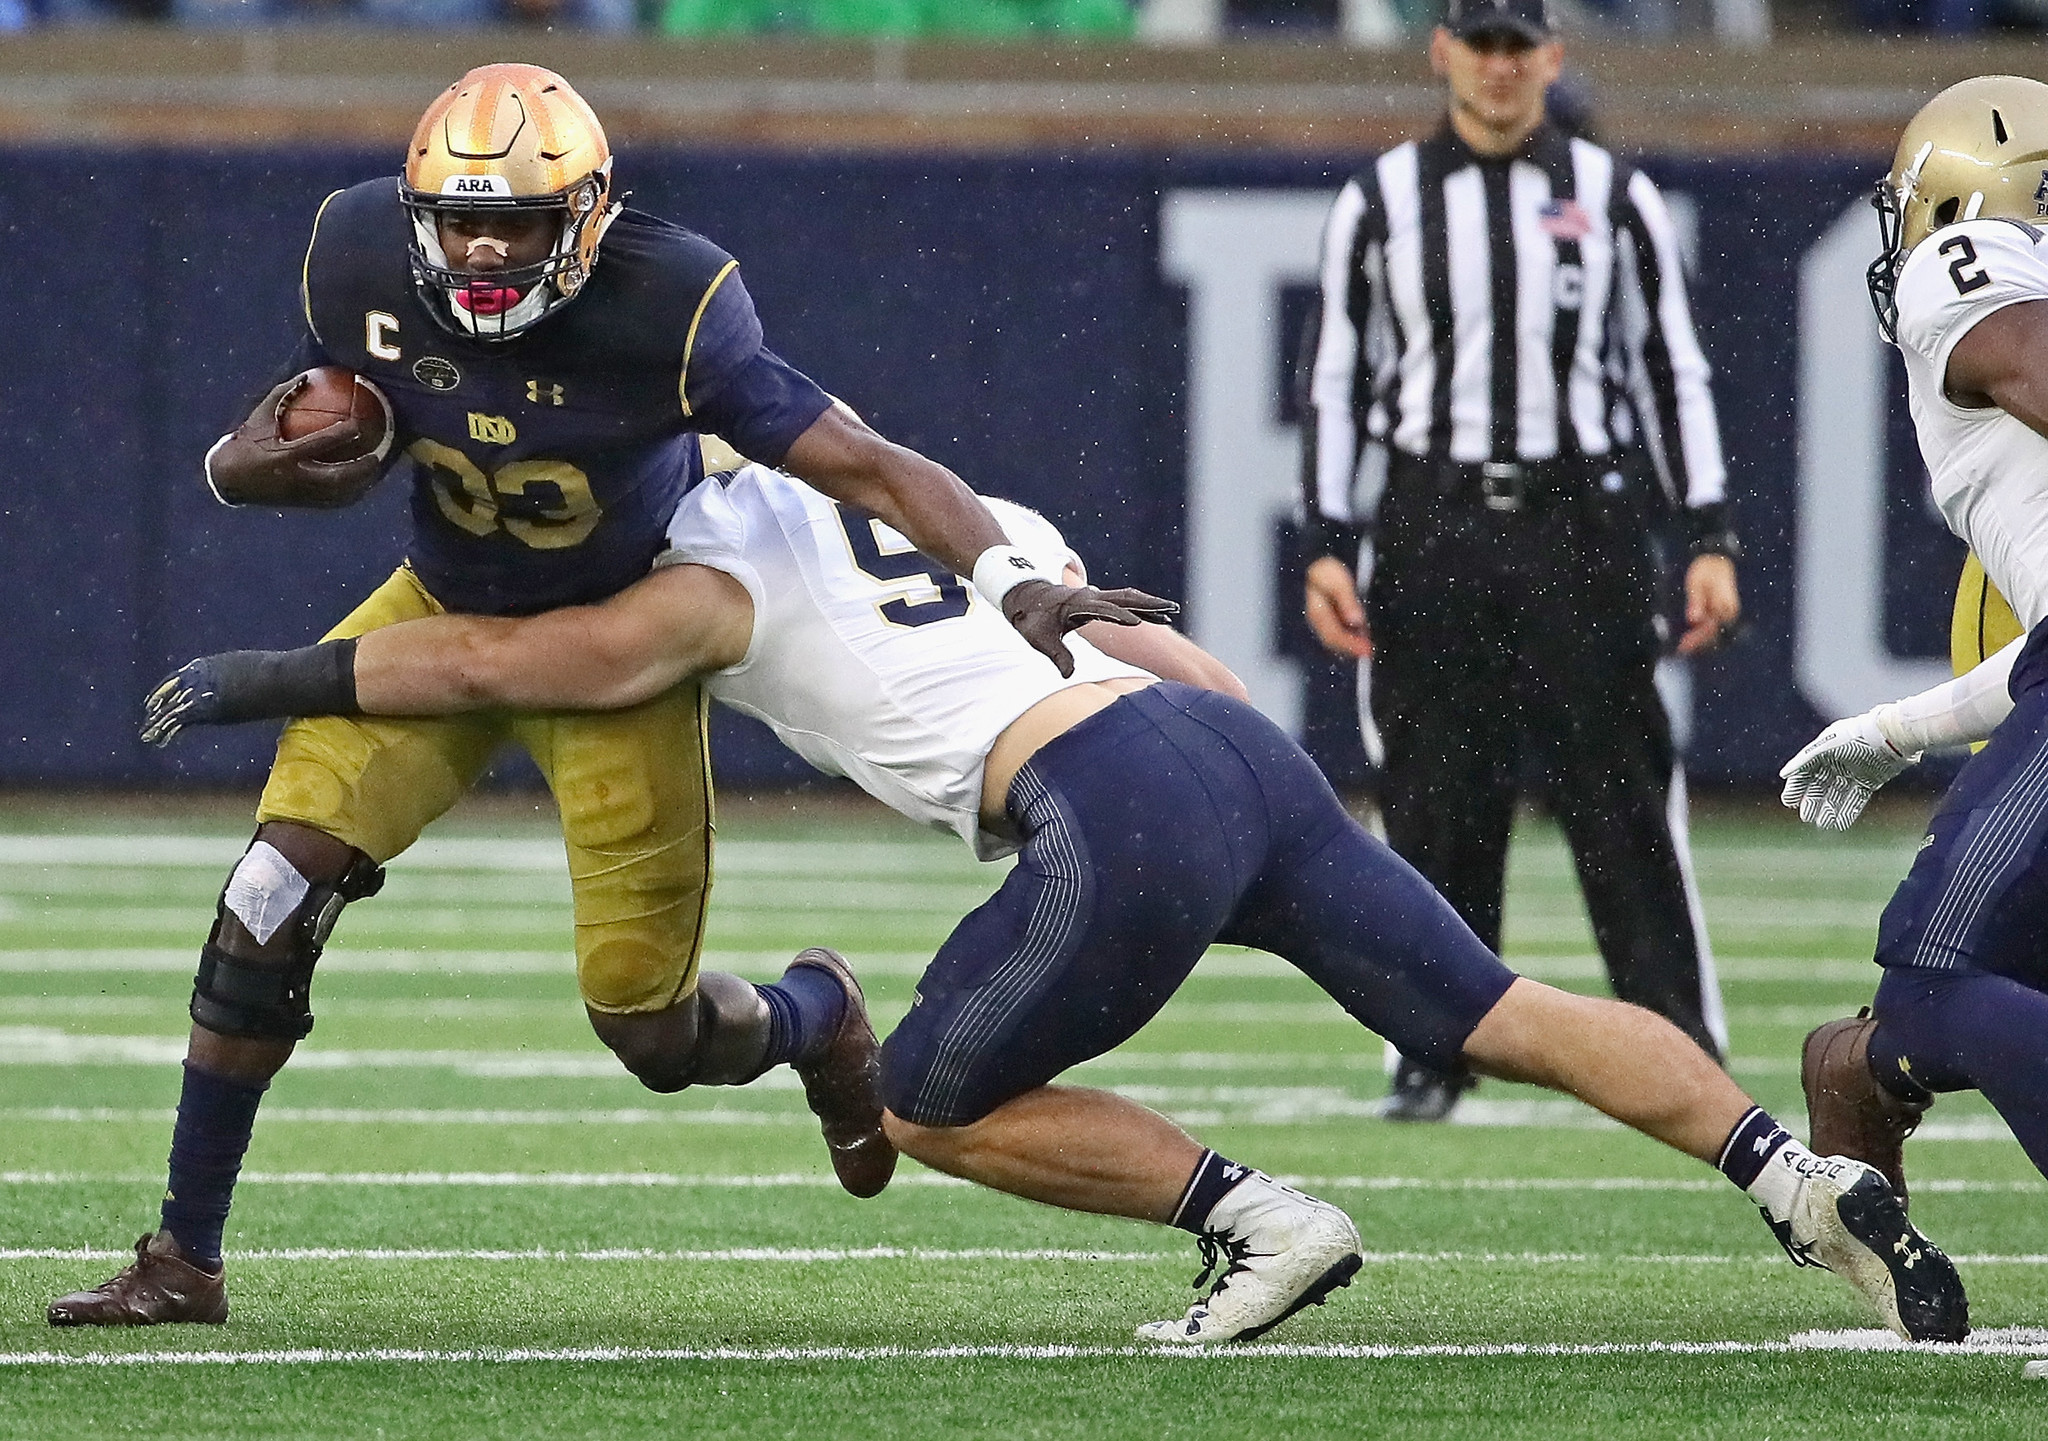
3. I’m worried for #33trucking. Hope he’s legitimately ok to play. Thoughts of Jaylon and Doug creep in.
4. Seeing McGlinchey tear up and bear hug his mom during the Sr. Day intro made everything ok.