
We’re now on to the 5th year under Brian Kelly in this review and so far we saw a poor 2010 season, tremendous 2011, pretty good 2012, and the 2013 season bottomed out almost to the levels of 2010.
The good news is that things improved for 2014. The bad news is that the run success didn’t quite make it to the levels achieved in 2011 and 2012.
Run Success Definition
A play counts as a success if it gains 40% of yards on first down, 60% of yards on second down, and 100% of yards on third or fourth down. If the team is behind by more than a touchdown in the fourth quarter, the benchmarks switch to 50%/65%/100%. If the team is ahead by any amount in the fourth quarter, the benchmarks switch to 30%/50%/100%.
2014 Rushing Stats
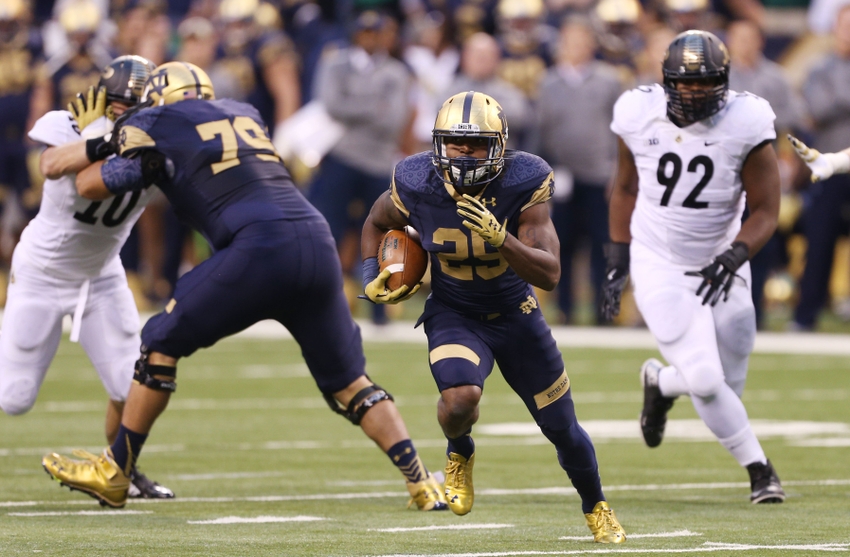
Folston, 175 attempts, 889 yards, 5.08 average, 6 TD
Bryant, 54 attempts, 289 yards, 5.35 average, 3 TD
McDaniel, 77 attempts, 278 yards, 3.61 average, 4 TD
I’ll have more on this topic when I recap this whole series but the lack of explosive “big chunk” runs really devastated this 2014 offense. They really had to grind out so much of their success on the ground, and then of course the turnovers blew up the season after such a hot start.
Run Success (2014)
| Player | 1st/2nd + | 1st/2nd – | 3rd/4th + | 3rd/4th – | Total |
|---|---|---|---|---|---|
| Folston | 91 | 75 | 6 | 3 | 55.4% |
| Bryant | 29 | 23 | 2 | 0 | 57.4% |
| McDaniel | 30 | 31 | 8 | 8 | 49.3% |
Sophomore Folston
The thing about Folston was that he showed up on campus and was pretty much the what you see is what you get type of running back. The skill-set he flashed as a freshman was exactly what you’d see as a sophomore. To hammer this point home Folston went from 55.6% run success in 2013 to two-tenths less successful in 2014. Virtually the same.
Not that this is a bad thing. We mentioned how in 2013 he was dominant in a couple easier games but pretty poor in other games–for 2014 he found more overall consistency.
Nevertheless, Folston was out of the box quite successful but spent 2013-14 several tiers outside the best running backs in the game. In my opinion, Folston probably put on too much weight. I always thought it was crazy how he showed up 35 pounds heavier on a 5’9″ frame as a freshman versus his reported high school senior year weight. It might not have been bad weight necessarily but that body type was always going to limit him athletically in the open field.
Bryant’s Goodbye
It’s crazy to think that Greg Bryant finished second on the team in rushing yards and it felt like he barely played. Well, he practically barely played in reality with 2 or fewer attempts in 6 out of the final 7 games. Just like that his career under the dome would be over as he’d transfer out of Notre Dame and sadly lose his life back home in Florida.
To this day, I don’t know what to make of Bryant and his talent. He looked like a million bucks that’s for sure. His major debut (Rice) and finale (USC) of this season saw him put together 14 successful runs to just 1 unsuccessful run. However, the stuff in between was decidedly average although one could always complain he didn’t get enough of an opportunity to prove himself.
Gritty McDaniel
Let’s be honest, as a senior McDaniel morphed into a quasi-fullback especially late in the season as his carries decreased and Folston completely took over the position. By the end of his career McDaniel was really trudging along trying to pick up tough yards and important third downs.
Among all Irish backs during the Kelly era with at least 50 carries his run success rate was second worst. And as much as it pains to bring up again, McDaniel’s reputation as the dependable runner will forever be marred by his late fumble against Northwestern in 2014.
Notre Dame had some success on the ground for 2014 but the combo of McDaniel and Folston was far too similar. There was no thunder and lightning. It was a double shot of shorter thunder(s). I also kind of felt like McDaniel at 5’10” put on a little too much weight by his senior year, too. He was super quick in high school and during his Pro Day dropped 20 pounds to gain back his quickness.
Other Fun Notes
Run success may be really important but of course the game of football is too complex for it to be the lone predictor of winning. Remember, the Irish had a 50% or below run success in 6 games during the 2012 season and won all of them. This 2014 team was actually far more consistent with just 3 games of 50% or less, it’s just they didn’t have any major dominant performances (or a dominant defense backing them up).
One of those poor outings for 2014 was against Stanford with just 4 successful runs to 20(!) unsuccessful runs. The Irish even opened the game with 8 straight unsuccessful running back carries–and still won the game! In general, Notre Dame flopped HARD in 2013-14 with RB success rate against the Trees. If you can believe it there were 37 unsuccessful carries and just 10 successful runs in those two games against Stanford.
Want an important missed moment from 2014? Tarean Folston couldn’t convert a 4th down near midfield while leading Florida State 14-7 on the road. Who knows how things play out with a conversion and score on that drive?
The amount of rushing on third and short under Kelly is interesting. It started really low in 2010 at 58.1% and then increased steadily in 2011 (66.6%) to a very run-heavy 75.4% in 2012. When it dropped back down to 66.0% in 2013 with Golson suspended it felt like a huge change. Yet, this 2014 offense fell all the way down to 54.1% for running on third and short.
This is crazy to me. The Irish running backs weren’t built to rip off long plays or beat teams with their speed. They were built to grind out these short yardage situations and either didn’t want to take the ball out of Golson’s hands or felt like they weren’t good enough to pull it off with the backs anyway.
The finale in the bowl game against LSU is funny because Notre Dame nothing but grinded out the damn game. From a run success perspective the tailbacks only finished with 10 successful runs to 14 unsuccessful carries. I know you’re thinking that Zaire carried the load, right? Well, he only had 10 successful runs out of 22 carries. With Golson’s one successful carry the Irish had 36.2% run success rate overall and somehow it felt like they really pounded the Bayou Bengals.
This is one of the aspects of run success that needs more context. The Irish were 11 of 17 on third down against LSU and did just enough to keep the chains moving and get into scoring opportunities–which Notre Dame did a really good job of taking advantage of when they got deep in Tiger territory. This game has always been held in high regard by most Irish fans but then again you also have to wonder if Kelly could get this type of effort without running the quarterback 20+ times and of course over the long run a sub-50% success rate won’t be sustainable.
But it worked for one bowl game.

These are all great. I think the bigger problem that I have had with the run game in the Kelly era overall is the inability to get the 3rd or 4th and short (under 3) on the ground on any consistent basis. The eyeball test tells me that we are way under 50% on those and probably under 50% when it is 3rd and 1 or less. That is just unacceptable.
Most years, we have good success with big chunk runs, but it seems that when we line up to run it, and the other team is lined up to stop the run, we don’t get it done.
I understand the world has changed and 3rd and 3 or longer is predominantly a passing down in college and the pros. That there is no fullback. That the QB will be in shotgun, largely to either be a run option himself (college level) or to make a pass more of a viable option to allow the fullback to be the 3rd WR (pro and college level).
I hear so much, year after year, about how our OL can really dominate (best unit in the country in 2016 preseason), but we can’t seem to get it done consistently year after year in crunch time. I am not expecting perfection, just at least as good as a coin flip. Since it seems to be a perennial thing, it has to be scheme or coaching and not individual players because they change.
Perhaps the data contradicts my eyeballs, but these studies seem to validate my eyes.
Here’s what the data says….I went and put together Notre Dame and Alabama’s stats over the last 3 seasons:
2016
3rd & Short
ND: 32 rushes (10 passes), 20 first downs (62.5%)
Bama: 50 rushes (10 passes), 37 first downs (74.0%)
4th Down
ND: 9 rushes, 8 first downs (88.8%)
Bama: 12 rushes, 5 first downs (41.6%)
2015
3rd & Short
ND: 28 rushes (15 passes), 16 first downs (57.1%)
Bama: 40 rushes (15 passes), 25 first downs (62.5%)
4th Down
ND: 4 rushes, 3 first downs (75.0%)
Bama: 13 rushes, 8 first downs (61.5%)
2014
3rd & Short
ND: 26 rushes (22 passes), 19 first downs (73.0%)
Bama: 49 rushes (17 passes), 27 first downs (55.1%)
4th Down
ND: 10 rushes, 3 first downs (30.0%)
Bama: 8 rushes, 3 first downs (37.5%)
I’m not sure how much we can take from the 4th down rushes (because they aren’t filtered for 1-3 yards) but we’re better than Alabama. But, the Tide could have half of those attempts while blowing opponents out and running on 4th and 6 past midfield, or situations like that. That would take a deeper dive.
Add the stats up and we converted 63.9% of our third and short rushes and Alabama converted 64.0% over this 3-year span.
They ran the ball 76.7% of the time in those situations and Notre Dame ran 64.6% of the time.
Notre Dame converted 59.5% of their 3rd & short passes and Alabama converted 50.0%
Now, the possibility may be that Alabama converts at a higher clip most of their games and then their 3rd teamers really struggle late in games when they get brutally conservative.
The big thing that sticks out is that Alabama ran 48 more 3rd & short plays over the 3 seasons. That’s probably due to being a better offense overall and thus running 525 more plays overall than Notre Dame.
My 2 cents…..
Picking up 3rd & shorts really isn’t much of a problem. Why does it seem that way for so many people?
1) We go to the QB to pick up those yards more than some other teams
2) We don’t run the ball heavily in those situations
3) Notre Dame doesn’t have a great defense to protect the team overall
Alabama has failed on 50 rushing attempts on third and short since 2014, yet they’re known as a tough running team in part because their defense almost always never allows those misses to hurt them that much.
I’ll cover this more in the recap to this series but from what I’ve seen while researching and adding a few other programs into the mix lack of big chunk plays on the ground is possibly the BIGGEST problem with the Irish running game. I’d say for the offense overall it’s turnovers, then lack of long runs, and the third problem is miles away from those two.
Anyway, hope that helps provide some insight.
Shouldn’t McDaniel’s reputation as a dependable runner be marred by the fact that he wasn’t actually a dependable runner? The data sure seems to back up that he was just not very good.
I may not be reading the chart correctly, but he did appear to be the best we had for 3rd and 4th downs. Even if he wasn’t good, he appeared to be the best we had for those situations.
That said, I was at the Northwestern game. It was the worst game I have ever seen in person, and I have seen some miserable games. To lose the way we did AND to have the weather be as miserable as it was…there are levels of suffering of which this game managed to capture every facet.
I still want to throw up just thinking about it.
8 positive runs and 8 failed ones for McDaniel, not the best!
Yeah. I wasn’t reading it correctly, then.
If you’re a “dependable” running back that’s pretty much a criticism, IMO. No one wants that label.
That reminds me of the scene in the movie, “Blackhawk Down” when chalk 4 was ordered to move to the Wolcott crash sight.
Eversmann: There’s a Black Hawk down. Twombly, Nelson — you’re gonna stay stay here and hold this corner and then exfil with the humvees.
Nelson: How come I gotta stay back here?
Eversmann: Because you’re dependable.
Nelson: I hate being dependable man.