
Introduction:
For my first piece on 18Stripes, I had to think about how I could contribute. I know less about football than Burgz or Larz (and others), and very little of recruiting compared to Brendan and Tyler (or anyone). However, I know a fair bit about scientific research – and I know a lot about hating other teams. My particular prompting for this piece was that the team I hate most has changed over time. From 2002-2010, the team I most hated was USC. From 2011 to 2014, it was Michigan. From 2015 until the present, it’s been Stanford. I was surprised by this, and I’m wondering how much of my own craziness can be explained by science. It turns out that the answer is: “A fair bit!” Some people have studied this a lot.
My goals here are to:
- Summarize the theory and evidence of sports team rivalry, as laid out by researchers who specialize in this subject
- Test how this explains my personal rivalry rankings
- Have some fun and hear your stories of loathing other teams
Outline of the Science:
Let me start with an important disclaimer: When I say ‘science’, that term should be treated loosely here. I’m sure the authors are doing their best, but at the end of the day, when people talk about ‘science’, they’re not talking about some objective force; they’re discussing currently accepted theories that might be based on flawed data (or flawed interpretations of that data). This is true even in the hard sciences (physics) and doubly true of any social science (like economics, psychology, or sociology). The next time you read a headline that says ‘Science says X’, realize that article has been written (or at least edited) by someone who hasn’t spent a lot of time on ‘science’.
The work I’ll discuss today comes from by B. David Tyler and Joe Cobbs. They’ve made a career studying sports rivalry and there are two papers in particular I’ll be summarizing: one is a discussion of the factors that determine rivalry and another is a careful look at measuring rivalry.
Let’s start with the factors that define rivalry. In their paper “Rival Conceptions of Rivalry: Why Some Competition Means More than Others” [download here], Tyler and Cobbs sent out written surveys that were filled out by 37 fans. The researchers (and probably some underpaid graduate students) then verbally coded different aspects of the responses. So, for example (from the paper): “The teams play in the same division and meet many times each year” would be coded as ‘frequency of competition’. Then, once they’d coded the qualitative text into a binary variable (e.g. frequency of competition – yes or no) they could tally all the different factors that defined rivalry. They initially coded 25 different variables, but then reduced / collapsed the coding to 11 different variables.
If you’re like me, you’re alarmed that there’s only 37 data points (read: 37 people completed the survey / wrote essays about what rivalry meant to them). I think the good news is that the researcher findings match what you might intuitively respect. Even better, they ran another survey with an N of 472 fans to see which of these 11 variables people reported as most important to feeling a rivalry towards a team. Once they had reported importance scores for each of these dimensions from the fans, they used a technique called Principal Component Analysis to determine the number of factors that best explained rivalry. They found three main factors explain 60% of the variation in report rivalry scores; based on the relationship between these factors and the 11 different recorded variables, they decided to call the three core factors: Conflict, Peer and Bias.
The list that follows is verbatim from Tyler’s and Cobb’s website; it shows that each of the 11 reported contributors is most correlated with only one major factor; the only exception was competition for personnel, which was almost equally correlated across Conflict, Peer, and Bias. After each of the 11 elements, in brackets, I record the average score (on a scale of 1-6, 6 being highest importance) that the 472 fans assigned to its importance in defining their reported rivalry.
- Conflict – There are five observable factors that define the first principal component:
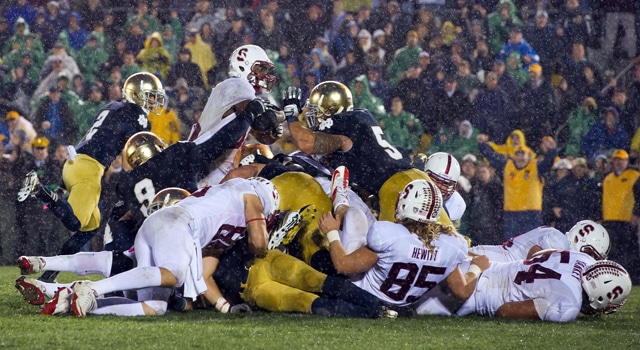
- Defining moment [4.72]: Specific incident, positive or negative, between the competitors. For USC, this is the Bush Push. For Stanford, this is the glorious 2012 stand. For Michigan, you can pick. I’ll choose #RememberTheSix.
- Frequency of competition [5.12]: Recurring competition between the opponents. USC, Stanford, and Michigan all check this box – recently, at least.
- Historical parity [4.7]: Comparable success over a long period (greater than 10 years)
- Recent parity [4.72]: Comparable success within the last 10 years – As we’ll see, this is true of USC, Michigan, and Stanford
- Star factor [4.7]: Extraordinary individuals (performers, personalities, or legacies) – All three schools have produced notable talents
- Peer – There are three factors that define the second principal component:
- Geography [4.61]: Teams are located close to each other – this is more true of Michigan than USC or Stanford
- Cultural similarity [4.12]: Shared values between the teams/institutions/cities – here, I would say Stanford and Michigan are more similar to us than USC, but reasonable people might disagree. Despite their recent hilarious scandals, USC is higher ranked than Michigan in US News and World Report’s ranking of undergraduate universities.
- Competition for personnel [4.38]: Competition for recruits, coaches, players.
- Bias – There are three factors that define the third principal component of rivalry:
- Cultural difference [3.51]: Disparate values between the teams/institutions/cities
- Relative dominance [4.52]: One team aspires to overcome the historical success or dominance of the other team
- Unfairness [3.37]: Perceived preferential treatment toward one team by league or competition authorities (e.g., governing bodies, referees). I mean, we complain about this, but I feel this is much more true of Ohio State (never investigated seriously for NCAA violations under Tressel and Meyer) than it is of any of USC, Michigan, or Stanford.
Conflict, Peer, and Bias are not equally important. In using Principal Component Analysis (PCA), the authors found that Conflict and Peer explained more about rivalry than Bias. Intuitively, this matches with the higher average score the fans assigned to each component of Conflict and Peer.
Application:
This research helps explain the shift over time in the degree to which I hate different teams. As I mentioned above: from 2002-2010, I hated USC the most. From 2011 to 2014: Michigan. From 2015 on: Stanford. Let’s see how the factors of rivalry for each of these three teams have changed over time.
Let’s start with USC. They claim to be an academic peer (cultural similarity) but most patently are not. While not a nearby school (geography), they have historical parity in terms of football performance and they meet the “frequency of competition” criteria. The Bush-Push is perhaps the worst defining moment of my college football experience (although it’s the poor spot on the previous fumble out of bounds that really upsets me).
What could have happened since 2009 that made me hate them less?
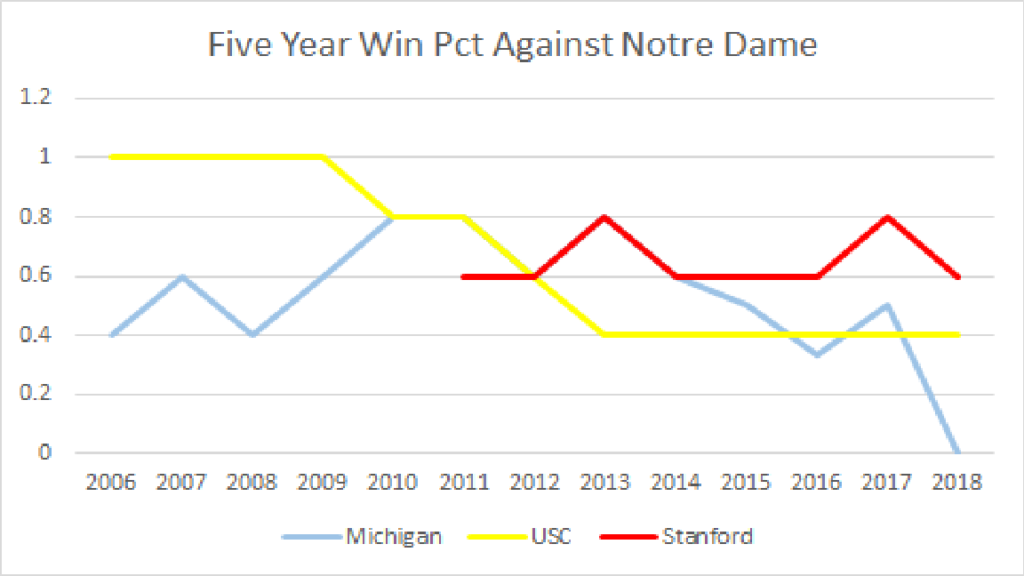
Ah, I see. They went from beating us eight years in a row to starting to lose to us more often than not. But that’s only one factor. Maybe something else happened to their program?
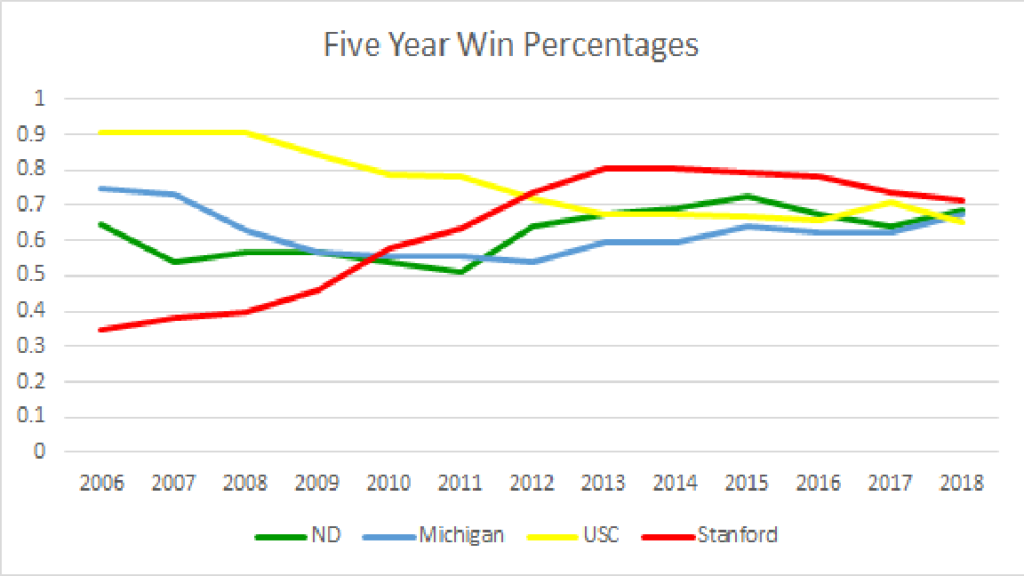
I’m gratified to see that their win percentage (recent parity) has fallen from an astounding .900 (Pete Carroll cheated, but was also a good coach!) to a more reasonable level. Let’s hope the decline continues. We should note that our own five year average will take some time to improve (thanks, 2016!), and in general, this is a pretty slowly changing measure. That makes USC’s decline all the more notable. Eric’s comments about how USC is basically decades of mediocrity sandwiching Pete Caroll seems… empirically descriptive. I would also note that there’s been some competition for personnel, but the diverging academic requirements (at least, for athletes) of the two schools have seemingly reduced this over time. Please correct me if I’m wrong, recruitniks. All of these factors contribute to a decline in the relative sense of rivalry.
We see Michigan was beginning to improve as USC’s performance (both in general and against ND) declined. The above chart of win percentage makes it hard to see – for which I apologize – but from 2010 – 2014, Michigan’s five year win pct against ND was 80%, 80%, 60%, 80%, and 60%. We would lose to Michigan in bizarre and horrible ways (defining moments), and in 2009 at the Big House we were on the wrong end of two of the worst referee / review calls I’ve seen watching ND (unfairness). Michigan is just down the road (geography) and another historical peer – #1 and #2 in win percentages.
But then 2014 happened. 31-0 (37-0!) happened. The failure of Brady Hoke made it clear that Michigan was stuck in neutral, and their five year win percentage began to fall, and with the failures of Hoke’s latter seasons, the perception of recent parity disappeared. Most importantly, we suddenly stopped playing Michigan every year – the frequency of the competition disappeared. As of this year, they have beaten us zero times in the last five years… and we’ve only played them twice.
The rivalry I felt toward Michigan has faded. Sure, I’m sure I experience the same sense of schadenfreude about their losses that most of us do – and more so for Michigan than for programs we have played less frequently in recent times, like Florida State. But I don’t compare Notre Dame to Michigan anywhere near as much as I used to, and when we stop playing them (I hope forever, because the game really brings us zero benefits as a team) after 2019, I expect the difference to be even more noticeable.
[Side note: I think the rivalry with Michigan for me was much more about dealing with Michigan fans. Two of my best friends are UM fans and incredibly classy about Michigan’s wins and losses. But the rest of the Michigan fans I know are among the least gracious fans on the planet. So it was highly important to me that ND win those games. Losses to USC never brought the day to day misery that losses to Michigan did.]
Now we get to Stanford, who I’ll say that no Notre Dame fan ever hated until very recently. I didn’t even think about them at all until 2010, when I found myself thinking: “Darn, these guys look good!” By 2011, I was experiencing frustration about our losses to them. Stanford is very well explained by Tyler and Cobbs’s research. We weren’t even playing them until 2007 (this is why their five year win pct against ND is missing for the first several years of the chart above), so until recently there has been zero competition. Now they’ve got a five year win percentage against us of .6 (which will stay that way even if we win again this year) and their 5 year winning percentage has been above ours since 2010. We are most definitely competing with them for personnel, in large part because they are the one D1 football program where the academic standards (at least for entry) are higher than Notre Dame. For me, this constitutes cultural similarity – at least relative to other D1 schools.
I’ve been on Stanford death watch for five years. Credit to David Shaw: I’ve been wrong every year. But this year I’m not alone. I’m hoping that the forecasts of Bill Connelly, ESPN, sundry college football gamblers, and our own Brendan Reilly come to pass and that Stanford has another year of under-performance. They were supposed to have a gangbusters offense in 2018 and they did not; this year the veteran offensive line (and almost all their skill positions except QB and one WR) are gone. Their recruiting has slowly declined in recent years and they’ve had a lot of coaching attrition.
Please, God. Please.
Research Dessert:
I’d like to finish with one small summary of another paper: “All Rivals Are Not Equal”. In this paper, Tyler and Cobbs point out three more properties of rivalry:
- Teams can have more than one rival
- Rivalry is continuous in scale – there are different degrees of rivalry
- Rivalry need not be reciprocal – one team can see another as it’s rival without the feeling being returned
If you play around on the Know Rivalry Website, you’ll see that the 8th most unbalanced (not reciprocated) rivalry is the “Little Brother” MSU, who’s fans scored UM as a 67 out of a scale of 1-100 on rivalry points. UM fans scored MSU as only a 17.
The other one that jumped out at me was the #1 most unbalanced rivalry: Boston College fans scored ND as 72 out of 100. ND fans evaluated BC as a… 2. That’s right: 2 out of 100. Given when I started being an ND fan, I am delighted to say that thanks to Brian Kelly, my concern about BC has reverted to the population norm.
If you’ve made it this far in the article – thank you! I’d love to see your comments and hear your own thoughts and stories on rivalry. Looking forward to spending more time with you as we get nearer to fall.


Pete Sampson said it last summer but “usc is our rival, Michigan is our enemy”. That about summarizes it, I hate Michigan, i hate the 09 game (the first big game my then girlfriend now wife and mother to my children watched with me, a little surprised she stuck around), I hate the 10 game but I hate beyond hate the 2011 game. It will be to this day the worst game I’ve had a rooting interest in. I was too young for game 6 of the 85 World Series so this is it and forever and always **** Michigan
I get the hate. I think if we still played them every year, I’d rank them above Stanford as far as “most disliked.”
Great work!
Chuck Klosterman also had a pretty good article about archenemies and nemeses. Much less scientific (and like most of his stuff, probably mostly made up), but it’s an interesting take on the subject, too.
https://www.esquire.com/news-politics/news/a1532/esq0404-apr-america/
I *love* that essay. One of my favorites. I think I’ve seen this linked in other essays to why most ND fans hate Michigan instead of USC. If those aren’t public essays, then they are essays my friends and I have exchanged by e-mail.
Michigan has done so much to be Notre Dame’s enemy, and if they were still on the schedule, I’d expect I’d have them as #1.
NERD
You ain’t seen nothin’ yet! My next post will be even more nerdy, I promise.
I kid, I kid: this was very interesting! I tend to agree that Stanford is the team I would most like to beat year-in-and-year-out at this point, probably for the reasons discussed above! Though Clemson is making a rise up the rankings for me… but that’s really a one-sided rivalry until we beat them.
Quick ND Hockey interlude in the comments (welcome to being maltreated by the commentariat, Orlok): This Saturday if you have an extra TV in your March Madness setup ND plays Penn State for both the B1G Championship and a spot in the NCAA tournament. I’d been keeping an eye on the conference tournaments the last couple weeks and had hoped that the three wins the Irish racked up to make the finals would get them in, but it looks like it won’t be quite enough if tehy fall to Penn State Saturday night.
In the regular season the Irish finished #2 in the B1G and earned the right to host #4 PSU at Compton Family Ice Arena for the game, but these two teams are neck and neck for one of the last spots. RPI: ND #16, PSU #15. PRW: ND #14, PSU #16. USA Today poll: ND #16, PSU #17.
The game is at 8:00 on B1G Network.
@How dare people use this space to discuss things of interest?!@
Yeah I def think they need to win to get in. Should be a very intense game. PSU has a solid squad and a lot of talent it’ll be impressive if ND is able to pull this one off because of styles (wide open and prob more offensively talented Lions vs. the better D structure and goalie for ND). Hopefully being at home is the tipping point.
Dude, I only have one TV and it’s going to be fully dedicated to the Icers tonight. What is this silly hoopyball tournament everyone is going on about? Give me the hockey game 20 times before I watch any college basketball.
Awesome article, enjoyed reading it and learned from it! I’m weird and can acknowledge USC/Michigan as bigger rivals but for a lifetime of personal reasons my favorite opponent to beat is Michigan St. I totally get that it is not the program’s biggest game though.
As I’ve grown older I’ve stopped – or at least, mitigated significantly – the blaming of officials for losses, even in situations like FSU 2014 when it would be easy to do it.
Michigan 2009 is forever an exception. I’m convinced that game was outright stolen. Since the stakes in retrospect were virtually nil, that keeps any uproar about it to a minimum, though.
That game really has stuck with me. In my limited football watching, I think only OU can claim to have been more screwed, also for lower stakes (against Oregon). PAC-12 refs are the worst, as the single worst replay review I’ve seen (tied with UM 2009) was Duval Kamara’s catch against Stanford in 2007.
Good man, good man
Your most hated team that Notre Dame hasn’t played in at least 5 years?
Brilliant question! I’m having trouble stepping outside teams we haven’t played in five years. For example, I detest OSU because they truly break NCAA rules with impunity (under Tressel and Meyer), but we have played them. I hated how FSU let Jameis Winston do whatever he wanted. If only Clemson had beaten them the one game he had to sit out — which happened only after the media shamed FSU into going beyond their initial “first-half” suspension.
Thinking about this – if you asked me in 2012, it would have been Auburn. The whole Cam Newton being allowed to play left a bad taste in my mouth. Similar in 2013 with A&M and Johnny Manziel. I just wanted those teams to lose every game.
But they’ve been on major slides.
The next tier of hatred would be teams that are good but also overrated. UW at the beginning of this year was an example – I knew they didn’t have the talent to compete. Ditto for Oregon, who I always thought had a cool offense but also insufficient talent. Wisconsin is another, but I’m from Wisconsin and can’t hate them that much. In any event, it feels like people get this now.
I’ll cut short the historical reflection. In the present, it’s hard. I guess we haven’t played Alabama since 2012 and I’m always cheering for them to lose and release their stranglehold on NCAAF. But even then, my hatred of them is matched by my respect.
Who is it for you?
For me, I typically base hatred on “who do I most enjoy losing when we’re not playing them?”
Setting aside my 5-year rule my list would be Michigan (large gap), Stanford (large gap), Boston College (smaller gap), Miami.
I’ve been on record with not really hating USC at all. I lean more towards wanting that rivalry to be healthy and a premier game for us. And, we’re just so different that living in the Great Lakes region they exist way, way over there and not really in my consciousness a whole lot.
Using my 5-year rule I’d probably choose the following:
3) Baylor
A very recent addition following their scandal-ridden era from a couple years ago. Nothing much else to it really. I would be happy if they lost 10 games every year for a few decades.
2) Penn State
Part of this is their scandal in recent times, too. But probably more so not liking James Franklin, thinking he’s kind of a fraud, but not enough to ignore that PSU is pretty good right now. So it’s a mixture of being wary they’re taking away some of our Midwest/East Coast shine and just not liking their program all that much.
1) Wisconsin
This one is weird for me because I don’t really hate Wisconsin but I love to watch them lose so much. Some of it is the NDN fascination with their offense and the hypocrisy therein of sacrificing one’s self to the altar of a pro-style running game at all costs. Some of it is recognizing they have some secret sauce of developing non-blue chips that keeps their program running. Some of it is getting by (sometimes) on a weak schedule. I don’t know, I just enjoy watching them lose on the big stage.
Good call on PSU. I root them against OSU and UM but otherwise have no love for them.
This is a really interesting question and would make for a brilliant article. All of the teams I can think of, we play regularly enough to not fit into the 5-year window. Like for me, my first thought is Miami because, of course. Second thought goes to LSU but unless we’re talking regular season they dont qualify. Then my last thought is Texas, but we played them in ’16. So I guess I’m with you in picking Penn State. I remember growing up and seeing the Snow Bowl game and I have memories of JoPa battling Lou and those memories stick with me.
As of September, it will be Purdue.
As of right now, Penn State!
I feel like UT could be a candidate by 2021, it’s always Ohio state when they’re not in the five year window. Feel like Texas a&m might make a run for it too, between jumbo elko and Jimbos nephew punching kragthorpe
Ohio State is the easy answer whenever they qualify. Northwestern we played just this last year, but don’t have on the schedule again, so five years from now they’ll be back near the top of the list.
The only team that readily comes to mind for me that actually qualifies right now is Tennessee. I went to the 2004 game in Knoxville and had basically zero positive interactions with their drunken dirty fanbase. Left their stupid rickety stadium clothes soaked with other people’s alcohol. On top of that it was a terrible game by any standard of football. The win was really the only redeeming factor.
I’m going to the Big House for the first time this year, so I’m bracing for a ’04 Tennessee experience, but if we win it’ll be worth it.
That’s surprising I thought Tennessee was way up there for fan relations with Notre Dame?
I’m down in Nashville and Bristol fairly often, am a Nashville Predators fan, and am generally very familiar with positive southern hospitality offered in Tennessee, but had a really bad experience being a visiting fan on Tennessee’s campus. I certainly haven’t shed a tear over the last decade of struggles for UT, although I likely wouldn’t share that with friends or acquaintances who are Preds/Vols fans.
Great article!
I went to the Tennessee game in 2004 and had a great time. Granted, I was with several UT relatives, but I did not have any bad experiences.
I can’t disagree with much here – USC- rival and mich – enemy. I really despised MSU back when they beat us 5 years in a row under Davie, but the HR Pufnstuf game was a mighty salve to that wound.
I am not quite old enough to remember the USC games in the 60s and 70s, but from what I have read, in terms of cheating refs, those games were supposedly horrific.
I cant hate on Tennessee. I just like them way too much. They have the second best fight song in the world, I LOVE their colors, their fans just seem so awesome.
Of the 5 year variety, there’s no team I enjoy seeing lose more than Alabama.
My most hated rival overall is USC, and that hasn’t changed even with their decline. But then I grew up in Northern California, so I already have a natural inclination to despise all SoCal teams.
USC will always be my most hated rival, though I have a weird sort of respect for them. We have played them every year since I was a freshman (in the fall of 1970) and I feel like they’re the kid across the street you always fight with. If a new punk shows up, you hate him, but you don’t know him the way you know the kid across the street. I still relish every time I hear that USC has lost, and indeed, gloried in the 11 year streak from 1983 up to 1993 when we won every game against the Condoms (keep that in mind the next time you are miserable about the consecutive losses to Pete Carroll). When I saw us beat USC in person in 2015, I sat at my seat in the cold of Notre Dame Stadium for almost an hour after the game, just enjoying looking at the scoreboard.
I hate Michigan but I hate them for the reason mentioned by someone else in this thread; i.e., my experiences with their fans have been the worst. I’ve interacted with USC fans, both before and after the game, and there is a true mutual respect. Virtually every interaction I’ve had with Michigan fans (admittedly, relatively small sample size) has been negative. This has led me to say, about Michigan fans, that “never has so much been said with so little justification.” I love beating them, but hell, I love beating Michigan State and Purdue. Beating them just means I don’t have to put up with their boorish fans.
Stanford nets a big yawn from me. I know their fans aren’t as into the game as I am, and I also know that, even with their record against Notre Dame the last 9 years (they are 6-3 against us), we’ve made more of an impact on the national stage than they have. I will concede that the 2012 game was the 2nd most exciting game (at least the 4th quarter and the OT) I’ve ever attended (nothing will match USC, 1973).
As for schools we haven’t played in the last five years, it’s likely Ohio State for the reasons mentioned here, i.e., geographic closeness coupled with their seeming imperviousness to scandal despite inviting it to an incredible degree. They won their National Championship in 2004 with a freshman running back (Maurice Clarett) who was obviously just there for football, and who left campus after his freshman year, assuming he even completed that academic year (remember the Buckeye quarterback who questioned the need to go to class). Then they won their last National Championship with one of the most dishonest and ruthless coaches I’ve ever seen. They are the antithesis of everything Notre Dame stands for.
It is funny how little Stanford fans care about football, and I believe this is an important aspect of mean reversion. Schools where fans care will on average have better football teams than schools where fans don’t care (over a long period of time, though we’ve obviously witnessed short term deviations).
1. Ohio State
Michigan fans might be bad, but O$U fans are easily the worst and most annoying in the country. Throw in all the other reasons that have already been mentioned for them.
2. Alabama
They’re the Patriots of CFB, only more so.
3. Michigan
4. USC
5. Stanford
If they continue falling on the field, they’ll drop off my list quickly.
USC is our rival and Michigan is our enemy, but Ohio State somehow manages to be worse than that. Screw them.
I dont really “HATE” Stanford at all. They really rank just about even for me with the likes of Georgia, Bama, Clemson, Miami, and other big name successful programs. There’s nothing really SPECIAL about them, they’re just a good resume builder and I want them to win. I dont regularly tune into their non-ND games and hope they get their pants spanked off their butts like I do scUM and fUSC. Eric has been pretty accurate in showcasing how your particular birth year generation tells you more about your hatred more than any of these predictive factors. Just like he has pointed out, people like me who are in our mid-30s to early 40s are more in the “hate Michigan” camp than anything. The mid-40s plus guys are SC and the 30-and-below group usually trend towards Stanford.