
Phew. The narrowest of escapes against Virginia Tech kept a 10-2 regular season on the table, but as you might imagine, it didn’t do much to appease the advanced metrics gods. One little oddity that came out of the game – Bill Connelly noted that Notre Dame had a 99% post-game win expectancy. That means that of the thousands and thousands of games that Bill has compiled information for, a team performance with a statistical profile like Notre Dame had in that game (2x first downs, +200 total yards, etc.) has won the game 99% of the time. It was very close to being the second time under Kelly that the Irish have lost a game with a 99% post-game win expectancy – the first was the 2011 USF game. Which, of course, also featured a 99-yard fumble return score by the visitors. Cosmic balance. Or something.
Recapping the methodology again: These aren’t actual SP+ win probabilities, as SP+ creator Bill Connelly doesn’t publish those regularly after his preseason previews. We used a slightly tweaked version of the formula that the Reddit guy reverse-engineered to get close to published probabilities. That formula does some probability magic on the differential in SP+ rating for the two teams (with a bump for home field), and voilà. The FPI win probabilities are updated weekly by ESPN, so those are the real deal.
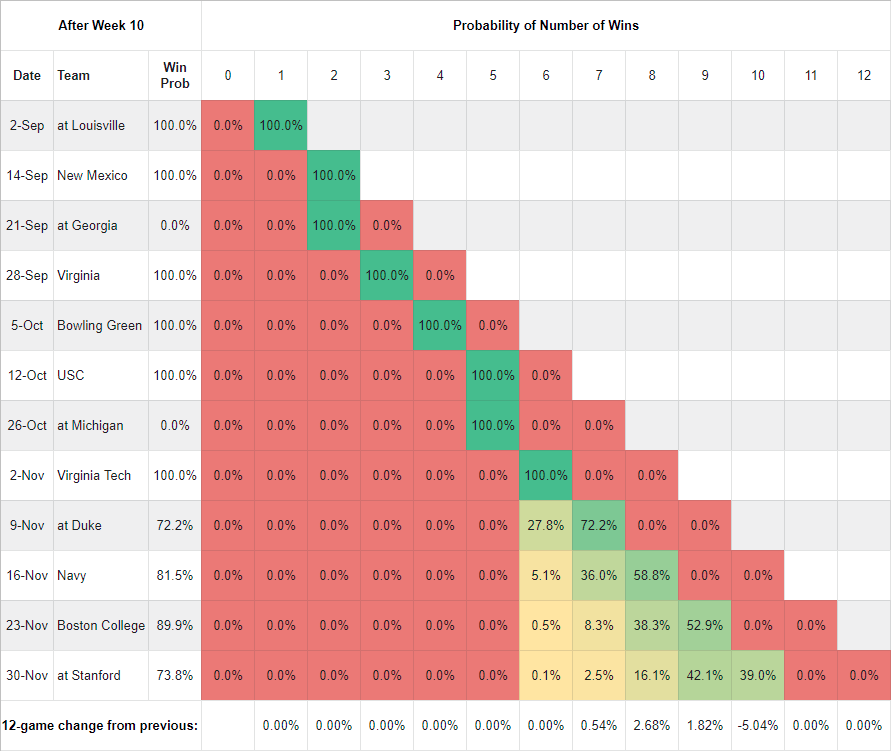
Post-Week 10 Update – SP+ Matrix

As you move down each column, you find the probability of Notre Dame owning that many wins at that point of the schedule. In the first row, you can see that the probability of owning 0 wins through week 1 is 0% and one win is 100%, since we already won. Same for the New Mexico row, and so on. In the last row, we’re tracking how much the probability of each win total has changed from the previous week. This is largely a function of our own outcomes, the quality of play that led to those outcomes, and SP+’s changing perceptions of our opponents.
The 27.7% figure at the end of the Stanford row reflects our probability of having 10 wins through 12 games – in other words, that’s our probability of winning out. The marginal increase in the probability of 10-2 is semi-good news, as last week SP+ considered 9-3 to be the season’s most likely outcome and 8-4 to be the second most likely. The bump to 10-2 moves it just ahead of 8-4 in the probability pecking order. Yay. Ceteris paribus a win over Duke would move 9-3 and 10-2 to nearly a dead heat in SP+’s eyes, so there’s something to pull for. Double yay.
Post-Week 10 Update – FPI
FPI remains more positive about the Irish than SP+, but its patience is beginning to wear thin. Note that FPI’s probability of going 10-2 dropped five points despite the win – not surprising as it accounts for game sequence, and Virginia Tech had a relatively high win probability for most of the second half. Like, 29.5 minutes of it.
Week by Week Game Trends – SP+
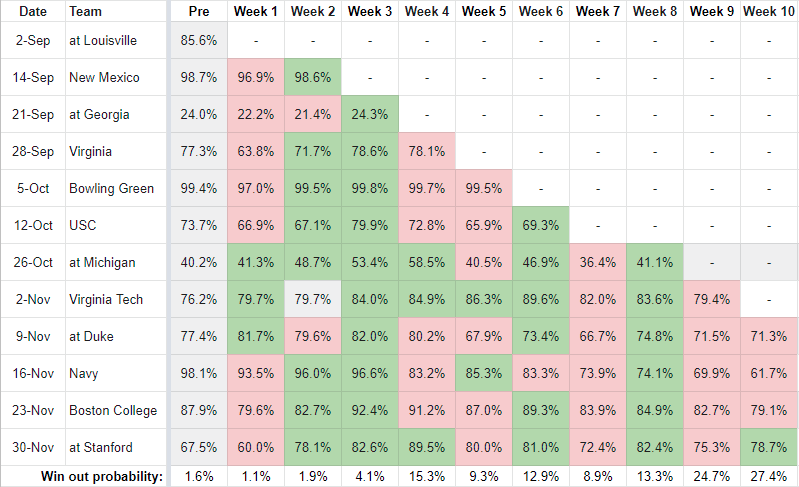
Very interesting here that the win probability for the Stanford game went up even though Stanford was idle. I assume it has something to do with their opponents’ performance, particularly USC – USC is a common opponent, granted, but Notre Dame squeaked out a win while Stanford got pounded.
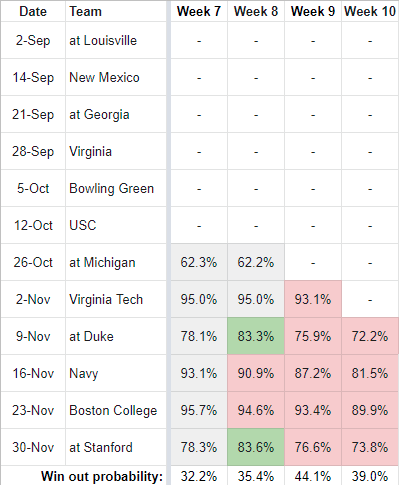
Week by Week Game Trends – FPI
Other Nuggets
- Winning out, or not: Notre Dame’s expected win total dropped a tenth of a game in SP+, to 8.90, and almost the same amount in FPI, from 9.26 to 9.17. Both metrics favor the Irish in all remaining games, but the Navy game is moving closer to a toss-up, which I know is what everyone wanted to hear…
- Anchors Aweigh: The big story for the stretch run here is that Navy is starting to look better than anyone imagined they would – over the last three weeks, the win probability for that game has dropped about 12 points in both metrics. A dominating win over Duke this week would be nice to help, ahem, right the ship, but regardless of how that game plays out Navy could be a bigger challenge than we expected. Triple yay.


I realize I’m in the minority, but I’m not that worried about Navy, or I guess as unworried as someone can be over the last 12 years of this series. Kelly has learned you have to be aggressive on offense and really stay on their throats, so to say. I think he will go for it more on 4th downs and punt less than the average game. And Navy can’t match Claypool. Kmet and I’d even run that back shoulder throw to McKinley a lot. Should focus on the size advantages and force targets to the big players. Then, defensively I think it’ll be alright. Lea shut Navy out for the first half last year (and by that time it was 27-0 and basically game over) and I think will be more than fine again. Jamir Jones had a huge hit this past game, I’d say the backup DL will be good and the run defend game has been generally strong (other than…you know).
Kinda ironic that Navy might end up being the best “win” on the resume this year, not that it matters much.
With Navy, I always worry about defensive players who haven’t seen the triple option live before. We’re fine on the line, maybe OK in the secondary, probably fine at both ILB spots (remember, White was the staff’s choice to fill in for Tranquill against Navy last year and he did really well, and played against some triple option teams in HS). Owusu is probably a guy Navy will try to target early, and I’d imagine with how he looked against them last year they’ll try to target Pride in the running game too. If they hold up, we’ll be fine.
Also, please please please close down creases quickly for Perry. He needs one step.
I haven’t really seen anything from the offense that makes me confident we can be efficient, which is what we need against a team trying to sit on the ball and limit possessions. We can’t have a bunch of empty three and outs and expect to win.
It’s interesting that SP+ and FPI are 20 percentage points apart on Navy. That’s a big gap even if they are different models!
Do the advanced stats have a probability for whether or not most Irish fans will be able to watch this week’s game (ACC network…why?!?)?
Check out HLS (also shared on OFD) for how to watch the game for free.
If you have cable you should be able to see it on the Watch ESPN app, which you either should be able to install on a smart TV/Apple TV/etc. or stream from your phone or tablet to a smart TV. Or you could hook up a laptop to one of the inputs on your regular old dumb TV and stream it that way. You’ll just have to enter your login info for your service provider in the app when prompted.
There are shady-ish sites that stream all kinds of sporting events as well, but be careful if you go that route as a lot of times they’ll try to get you to accidentally install adware (or worse) while you’re pulling up the feed. I haven’t used this site in a long time, but http://atdhes.eu is of that ilk.
If you have a smart box, you can do a free trial of YouTube TV (which has ACCN) and just cancel before it ends. Bonus, if you’re a ND hoops fan as well, you can watch tonight’s season opener in that time period too.
9-3 would make this a very long offseason.