
Well… That was fun. Remember that all advanced stats models include adjustments for garbage time, which is defined differently in each model but basically means being up by enough that both teams will change the way they’re playing; by any definition, Notre Dame reached garbage time before the half against Navy. What the Irish did up to that point, as Murtaugh highlighted in the game review post, are the kinds of things that impresses statistical models:
The Middies’ first and last drives of the first half showed promise but what happened in between, featuring 18 plays for 31 yards with 2 fumbles and a turnover on downs, absolutely buried them when Notre Dame scored touchdowns on 3 of 6 offensive snaps to build an early lead.
Recapping the methodology again: These aren’t actual SP+ win probabilities, as SP+ creator Bill Connelly doesn’t publish those regularly after his preseason previews. We used a slightly tweaked version of the formula that the Reddit guy who did these last year reverse-engineered to get close to published probabilities. That formula does some probability magic on the differential in SP+ rating for the two teams (with a bump for home field), and voilà. The FPI win probabilities are updated weekly by ESPN, so those are the real deal.
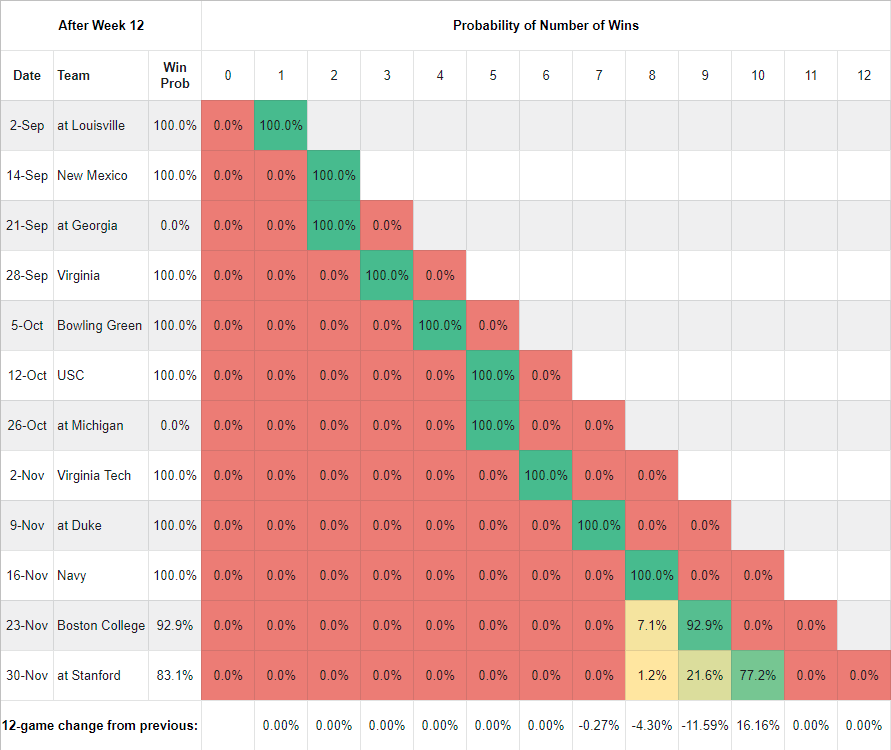
Post-Week 12 Update – SP+ Matrix

As you move down each column, you find the probability of Notre Dame owning that many wins at that point of the schedule. In the first row, you can see that the probability of owning 0 wins through week 1 is 0% and one win is 100%, since we already won. Same for the New Mexico row, and so on. In the last row, we’re tracking how much the probability of each win total has changed from the previous week. This is largely a function of our own outcomes, the quality of play that led to those outcomes, and SP+’s changing perceptions of our opponents.
The 73.7% figure at the end of the Stanford row reflects our probability of having 10 wins through 12 games – in other words, that’s our probability of winning out per SP+. That’s up a whopping 32 points from last week, as SP+ regarded Navy relatively highly and had it as a moderately difficult game (as did Vegas and almost every other statistical model). Accordingly, the odds of 9-3 and 8-4 dropped precipitously.
Post-Week 12 Update – FPI
FPI was much more bullish about Notre Dame’s chances against Navy, so winning the game did less to move the needle on the chances of going 10-2. However, it still did go up substantially, by 16 points here. Note also that for the first time this season, SP+ and FPI are basically in step about how we should expect things to fall out from here. Not terribly surprising with 10 of 12 data points in the books now, but still.
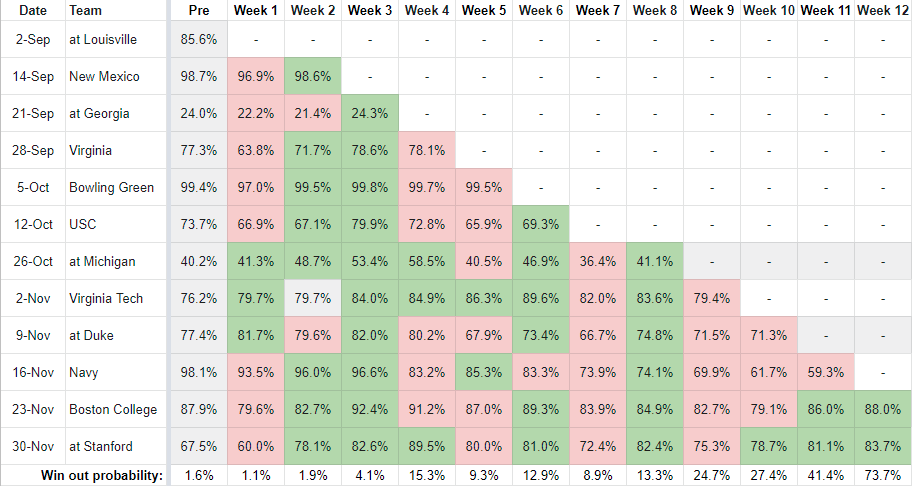
Week by Week Game Trends – SP+
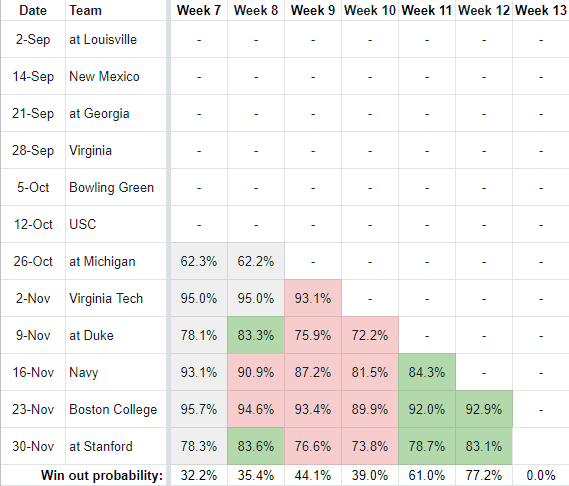
Week by Week Game Trends – FPI
Closing Thoughts
Changing the title of this section from “Other Nuggets” as the “nuggets” are exceedingly slim pickings now with just two games left. The eye test over the last two games suggests Notre Dame is playing its most complete football of the year right now, and the advanced stats models back up that impression. Yes, Duke and Navy aren’t Georgia and Michigan. Nobody would claim that. But there’s no question that the team, and particularly the offense, and even more particularly the defense, all have a very different vibe right now. As noted Notre Dame fan Ryan Nanni (where’s my sarcasm font?) said postgame…
Notre Dame has a very strong “good team we kinda stopped paying attention to once they lost a second game who throttles a big name in a bowl” aura.
— Ryan Nanni (@celebrityhottub) November 17, 2019
Let’s hope, Ryan. Let’s hope.


That tweet is solid. That feels like the penn state MO from the last 4 years. They keep ending up with 10-11 wins and a top 12 team. I would very much like that tweet to come true
I would love to see them get to measure up against a team like Auburn in the Citrus Bowl, but I don’t think that’s probably likely. Camping World looks more certain as less chaos happens. Most projections this week seem to be having ND/Iowa State. I imagine a story or two will be written about Matt Campbell…Would be cool if Texas can get up to that spot, at least ND/Texas has a better ring to it.
Iowa state is appreciably better than Texas and ok state per SP+ (granted I’ve o lot looked at top 25 rankings this week) so ironically the bigger name schools would carry more cache while we would more highly favored
Our path to the Citrus is exceedingly narrow – the short version is that it would require a Big Ten team to make the Orange, which in turn would probably require an upset winner of the Big Ten that doesn’t go to the playoff.
I think that if we win out and the SEC puts two teams in the playoff, we might be able to squeak into the Cotton. In that scenario the Rose would be filled by the Pac 12 #1 (Oregon/Utah) and Big Ten #2 (probably Minny/Wiscy/PSU), the Sugar would be filled by the Big 12 #1 (Oklahoma/Baylor) and SEC #3 (Alabama), the Orange would be filled by the ACC #2 (Virginia/Virginia Tech/Pitt) and the SEC #4 (Florida), and the Cotton would be filled by the G5 #1 (Cincy/Memphis) and a #10-ish ND.
The most likely scenario by far is the Camping World Bowl, though. The Citrus picks ahead of them if a Big Ten team lands in the Orange, but otherwise they get the first pick of ACC teams after the NY6 slots are filled. Absent the above scenarios, their choice would be the ACC #3 – an unranked, 4/5-loss Virginia/Virginia Tech/Pitt/Louisville/Miami – or a top 12-ish ND. Tough call.
True that. Really, in a perfect world Notre Dame should be able to take the ACC’s Orange Bowl spot. I mean I get the individual coaches would scream bloody murder over it, but other than Clemson no ACC team belongs this year. If ND was a full ACC member they would def take that bid for this season at least (and probably more in the future).
I don’t know if for $$ reasons they could make both ACC+ND happy but I mean if Notre Dame is eligible to take ACC spots, in theory it seems logical they should be able to take this one (especially when no ACC teams are NY6 worthy, save the one that’s going to the playoff).
For the Cotton:
There are 12 NY6 slots, which mean the highest 12 ranked teams, except where a team outside of the top 12 has a mandatory slot. For each one of those, the “top 12” goes down by 1. So…
Group of 5 is definitely coming from outside top 12. (11 slots remaining)
Clemson making the playoff gives unranked ACC #2 slot in Orange (10 slots…)
So with just those 2 things we’d have to finish top 10 to make it in.
From there it gets into more what-ifs:
Pac 12 gets into the playoff, and the Pac 12 runner up is below us, they still get the Rose (9 slots…)
Likewise for the Big 12 and Sugar. etc.
I think in the end a lot of it will be based on when the teams ahead of us play each other, will one drop out, or will they just jockey for position and we stay in the 12-16 range?
Teams that could finish ahead of us:
ALMOST CERTAINLY
LSU
Georgia
Bama
Florida
Clemson
Ore/Utah (one of these)
Okla/Bay (one of these)
tOSU/PSU/Mich/Wisc/Minn (two of these) *there’s certainly going to be some carnage here, but for every loser there has to be a winner, I have a hard time seeing 4 of the 5 all dropping below us.
That puts our ceiling at #10
COULD ALSO END ABOVE US
Auburn (if they beat Bama, and Bama would stay ahead of us)
Both Bay/Okla if Baylor wins championship
A third Big 10 team
Cincinnati/Memphis if one wins out including championship
These are much less likely, but in combination it seems that at least one of these happening is reasonable. In which case we’d be at #11, and out of the NY6.
Good breakout. It’s a bum year with the rotation of the NY6/playoff bowls that already made it tough for ND to be a NY6 team.
Stewart Mandel at The Athletics’s current projections are rough. Only the Sugar bowl looks good, Rose Bowl is at least decent and the other two games don’t look that appealing at all for major bowl games.
Cotton: Florida (at-large) vs. Memphis (at-large)
Orange: Virginia Tech (ACC) vs. Alabama (B1G/SEC/ND) lolololol
Rose: Penn State (B1G) vs. Utah (Pac-12)
Sugar: Oklahoma (Big 12) vs. Georgia (SEC)
(Playoff he has LSU/Oregon, Clemson/tOSU)
Really can’t wait until playoff goes to 8 teams. The tie ins are killing the “BCS Bowls” of non-playoff years.
I agree that it’s not tremendously likely, and I agree that our reasonable ceiling is likely at #10. *If* we get there, and *if* the SEC gets two teams into the playoff, I think we’ll be in the Cotton.
Playing out the scenario further…
– Ohio State beats Penn State (knocking them down but still above us) and Michigan (knocking them below us, especially if it’s decisive), and then hammers the Wiscy/Minny winner in Indianapolis, knocking them below us (the Wiscy/Minny loser would very likely already be below us). Ohio State goes to the playoff and Penn State goes to the Rose, and no available Big Ten teams would be above us at that point.
– Oklahoma will likely win the rematch with Baylor, pushing them below us. They also could very well lose at Okie State next week, which would help us a ton. Oklahoma will go to the Sugar, and no available Big 12 team would be above us.
– Oregon/Utah winner will go to the Rose and loser will almost certainly fall below us, especially if it’s Utah as one would expect.
– The ACC… LOL.
– Which leaves us with the SEC. If Georgia beats LSU, I strongly suspect both will go to the playoff – one-loss LSU will have a better resume than anyone else competing for that fourth spot. Alabama would then go to the Sugar and Florida would go to the Orange, leaving no available SEC teams above us.
So we’d be around #10, maybe #11 if Cincy/Memphis jumps us, with no available teams above us for the at-large Cotton bid. It’s a narrow path but other than Georgia over LSU it’s not super crazy.
I really don’t want to face Iowa State, mostly because I think Matt Campbell would outcoach Kelly and we’d lose. I think we’d beat Texas and that would be much more fun.
Boy, I’m just not getting the Iowa State hype this year. They’ve played some absolutely awful games, and 4 losses against that schedule doesn’t really scare me that much.
I think it’s more likely than not that they lose to K State to end the year anyway, which would make this all a moot point.
Is the Orange Bowl contractually obligated to take the ACC champion, if not already in a playoff game? If Clemson were to lose the ACCCG, could the Orange Bowl still choose them as the ACC representative? Or they’d presumably fall out of the Top 4 & cannibalize another At Large spot?
I believe they have to take the ACC champ. So if the Coastal Div. representative beats Clemson. That team is in the Orange, and with (presumably) Clemson falling out of the Playoff, they would almost assuredly end up playing in the Cotton against the Group of 5 representative. This could create a more difficult road for ND to the NY6, but on the other hand it might not, depending on if the team taking Clemson’s place in the playoff vacates the other spot in the Orange opening a spot for ND there.