

You’ve heard us talk about SP+ many times here – in our advanced stats discussions, in our game previews, in our playoff projections, etc. Last year, an enterprising Reddit user who should be nominated for sainthood created a win probability matrix for every team in FBS and updated it every week. The same user did preseason matrices for all teams this year, but sadly doesn’t intend to keep them updated due to the volume of stupid fan abuse he received in the comments. Which proves once again that we just can’t have nice things…
Anyway, absent that heroic gentleman’s efforts, we decided to make our own little foray into something similar just for Notre Dame. This isn’t terrible but it is somewhat labor intensive, so there’s no way we were going to do it for all schools. If you’re also a fan of Nebraska, or Syracuse, or Oregon, or whatever, sorry. Them’s the breaks. On the upside, we’ll remind you of that every week when we update this.
A couple of important notes on the methodology… These aren’t actual SP+ win probabilities, as SP+ creator Bill Connelly doesn’t publish those regularly after his preseason previews. We used a slightly tweaked version of the formula that the Reddit guy reverse-engineered to get close to published probabilities. That formula does some probability magic on the differential in SP+ rating for the two teams (with a bump for home field). I applied this formula to the preseason ratings and nudged it a bit until most of the probabilities were within 1-2 percentage points of Connelly’s published numbers, and will rely on that formula for the rest of the season. So it won’t exactly match the official win probability for each game but it’ll be close enough for our purposes.
Also, we’ll ask you to trust us on this one: working it out as the probability of X number of losses is much simpler than working it out as the probability of X number of wins. So the chart is mildly counter-intuitive in that sense, but you’re smart enough (?) to be an Irish fan so we’re confident that you can handle it.
Finally, a resounding internet high-five to NDZibby, our resident sportsbook/math dude, who removed the beam from my eyes on how to get this done. ND Engineering for the win!
Post-Week 2 Update
As to how to read this chart:
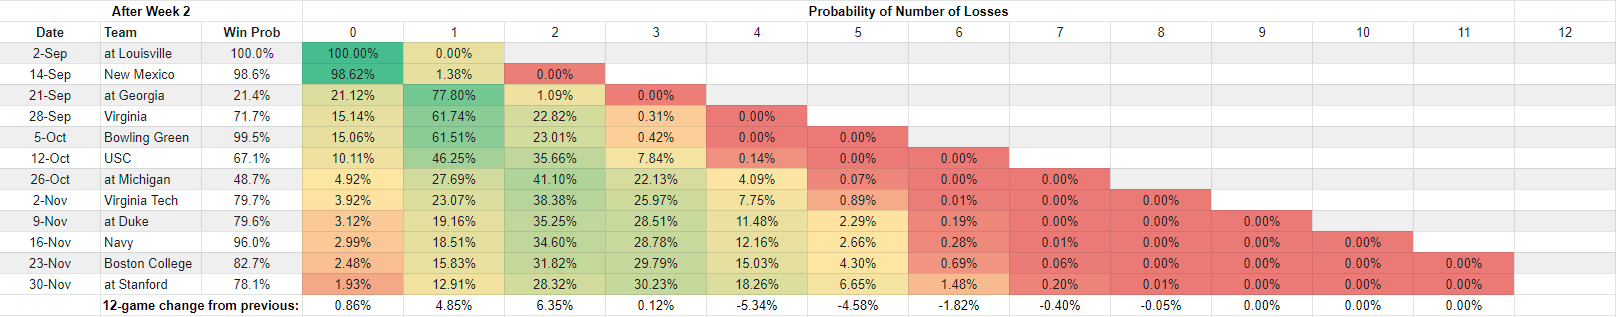
As you move down each column, you find the probability of Notre Dame owning that many losses at that point of the schedule. In the “0” column, you can see that Louisville is 100% since we already won. Our chances of having 0 losses after the New Mexico game are 98.6%, after the Georgia game are 21.1%, after the Virginia game are 15.1% and so on. The 1.9% figure in the Stanford line translates to our chances to be 12-0 at this point. The color coding ranges from green for the most probable outcome to red for the least probable. From this chart, you can see that SP+ predicts 9-3 as our most likely season record at 30.2% followed closely by 10-2 at 28.3%.
In the last row, we’ll track how much the probability of each loss total has changed from the previous week. This is largely a function of our own wins, obviously, as well as SP+’s changing perceptions of our opponents. For example, our win probability against Stanford jumped 18 points after their disastrous showing against USC, while our win probability against Michigan jumped 8 points after Army took them to overtime. (If you’re wondering, our win probability against USC stayed steady, although it’s down about 5 points from the preseason.) Those two shifts were the main drivers in a significant jump in the probability of 10-2 and 11-1.
Other Nuggets
- Tackling the “Big Three”: USC made a strong case for vaulting Stanford in the “toughest opponent” trio, but for now, we’ll keep the Cardinal in there as a marquee road opponent. Of the possible outcomes of visiting the Big Three hosts – Georgia, Michigan, and Stanford – the most likely scenario per SP+ is still 1-2 with a win over Stanford (31.4%), but by a whisker over 2-1 with a loss to Georgia (30.2%). I have a sneaking suspicion that Michigan’s impending visit to Wisconsin will shift that leaderboard.
- Taking care of business: SP+ has Notre Dame’s expected win total at 9.23. However, if the Irish handle their business in all the games they “should” win – defined for these purposes as having a SP+ win probability of 70% or higher – that expectation jumps to 10.37 wins.
- Movers and shakers: As noted above, there were substantial changes to Stanford and Michigan from week 1 to week 2. Other positive movers were Virginia (+8 points), Navy (+3), Boston College (+3), Bowling Green (+3), and New Mexico (+2 – both teams were off, so this is mostly about Louisville looking good in their second game). Negative movers were Duke (-2) and Georgia (-1). USC and Virginia Tech remained unchanged.


1) Can you make it bigger?
(^TWSS)
2) I want that burger.
I made the image clickable – it’ll come up full size if you give it a poke.
(^T also WSS)
Hahaha, walked right into that one. Well played, sir.
I like how the “Taking care of business” bullet point follows the sex panther cologne logic from Anchorman. 100% of the time we’ll win 70% of the time or something. Probably makes a statistician cringe but I like it.
This is very cool. Thanks for doing it! It is too bad that the comments of a bunch of idiots made the guy stop updating it during the season. After all, it’s a formula. As far as I can tell, there is no subjectivity to the process, right? Who argues with that? (Never mind; I know.)
Yeah… People go after Connelly himself on Twitter all the time, about how he has an SEC bias baked in or it disrespects Washington or overemphasizes defensive performance or handles garbage time wrong or whatever. He tries to explain that it’s just math, and the same formula is applied to everyone, but you can imagine how that goes.
Notre Dame fans – I poop you not – have been critical of him for undervaluing AND overvaluing the Irish. I’ll give you one guess where the overvaluing crowd originated from. Anyway, some people (1) have a big problem with math and (2) show a profound lack of gratitude for earnest effort, whether by Bill or the Reddit guy or someone else.
Haha yeah the outrage from NDN at him projecting like 10 wins before 2018 was pretty great. Not many fan bases have a group pissed about overvaluing your team. Good times
I was wondering what happened to the Reddit probabilities. Loved those last year so a big thanks for doing this.
Two thoughts I might offer for “improvement”:
1) It looks like you’re doing it in Excel. If that’s so, why not just create another chart (below, beside, whatever) that takes every probability and maps it to the appropriate (transposed) square where the value is “= 1.00 – [probability of x losses]”. That would instantaneously create you a probability of WINS chart (unless you’re worried about ties). Once you create the mapping, it would automatically update with any changes so its a one time thing that doesn’t have to rely on us reverse reading it in our minds. (If that’s unclear, or too much work, but you’re interested… if there’s a way to get me the excel file I’ll do it for you.)
2) If you narrow the columns a bit, the whole image would be skinnier, allowing it to show bigger without clicking (though I do appreciate that its clickable).
Not meant to be complaints, just suggestions to increase the awesomeness of something that already is!
I thought the same two things, but then I thought gift horses and all that. (you’d also then need to change the column headers from ascending to descending to reflect wins rather than losses)
Because it’s too much effort, lol. My motivation only goes so far! 🙂 We discussed the transposing briefly as more trouble than it’s worth, but if you’re willing to kick in… I did this in Google Sheets, so basically Excel. Just sent a sharing invitation to the email you used when you signed up here.
Changed the columns, that was an easy one. Thanks!
Scarponi’s gonna get such a huge royalty check now. Lucky.
Automatic rebate of 25% of his subscription fee. Eat your heart out, pal.
It is done.
Awesome man, thanks again! I’ll have to give you a shoutout in the next update.
Sure thing, you’ll of course have to revise your “How to read the chart” section for next time since it will be tracking wins rather losses.
Now I just have to get Eric to let me make the depth chart less colorful!
Lay out the color scheme for me.
Maybe something like this: https://docs.google.com/spreadsheets/d/1TbghLkocQtWT0yGSwnbAypQiuaiy9EXjL6U3KAnd_s8/edit?usp=sharing
Color choices are exactly my thing. But with that design there’s a general continuum where players move from dark blue to gold. The fact that it has that kind of continuum makes it easier to extrapolate things from chart. E.g. Knowing that Gold means pretty much out of eligibility and blue is pretty inexperienced, it only takes a brief glance at last year’s chart to immediately spot that LB and RB were going to go from experienced to very very young this year. (Something we already knew, but was hard to see in the current version of the depth charts imo.)
Obviously the color choices could be tweaked a bit if a different continuum (or shades) were preferable.
That should read: “Color choices AREN’T exactly my thing…”
Oh, you fancy with Avery Davis already moved to running back. I like where you’re going with the blue —> gold although it’s tough because you need green in there, too.
I think I did something similar when I had this chart but for different levels of Composite rankings.
Haha, its actually just a color modification of one of y’all’s versions from last year that at some point I had the link to in sheets. I needed it in sheets so I could copy and paste the base template before changing colors. Which means what positions players are at had nothing to do with me.
I tried just two colors but it seemed not varied enough then.
How about this?
Freshmen get gray then we proceed from blue to gold to green. Most should quickly get that, no?
Wouldn’t green go in the middle? Blue is darker than green is darker than gold (and also make the gray darker to be darker than the blue)
I was thinking it would be easier to remember the school colors are blue and gold. Green is special at the top and freshmen get drab gray.
Most important takeaway is, I guess I don’t really care, as I don’t actually pay attention to the Depth Chart (Which then begs the question, why did I comment in the first place?? ::Shrug emoji::)
My thought process was just that a light-dark or dark-light scale would be easier to remember (at least in my mind, YMMV) rather than having to refer to the key to tell what class someone is.
Definitely an improvement from what was imo!
I do agree with Drick about the dark -> light (which is what I was trying to do with my mock up), but I would find this consistent enough that it would track: Grey for those who aren’t likely to be involved yet, blue for breaking in, gold for leaders and special green for the guys who stick around to the end.
The lettering/shading combo is a very clever way to give an immediate visual connection for eligibility level and make it so now there’s only 4 colors to keep track of instead of 8.
This color scheme is more intuitive for me. I like it.
Now I’m waiting for Scarponi to break off and start his own ND site, not sure yet if I’ll port over there.
First 20 subscribers get an extra large welcome basket.
Awesome work!
Great work! I agree with some of the points above about playing around with it in Excel / Sheets.
Here’s one of my favorite math-misunderstanding moments. I was making a point about the lottery — that ultimately it can broken down as either you win, or else you lose. The other person’s response was, “so it’s basically 50-50, right?”
Heh… Sure… In totally unrelated news, I’m running a similar lottery at home that you can enter for $1000. Do the math yourself, pal, you won’t be able to resist the investment!