
Cheezborger cheezborger! For the second time this year Notre Dame benefited considerably from the bye week, both in the rankings (moved up in both polls last time and in the Coaches Poll this time) and in advanced stats metrics. SP+ in particular took a much kinder view of the Irish this week, presumably off the strength of respectable performances by past opponents – most notably USC, who thumped Arizona 41-14, and Virginia, who destroyed Duke 48-14.
Recapping the methodology again: These aren’t actual SP+ win probabilities, as SP+ creator Bill Connelly doesn’t publish those regularly after his preseason previews. We used a slightly tweaked version of the formula that the Reddit guy reverse-engineered to get close to published probabilities. That formula does some probability magic on the differential in SP+ rating for the two teams (with a bump for home field), and voilà.
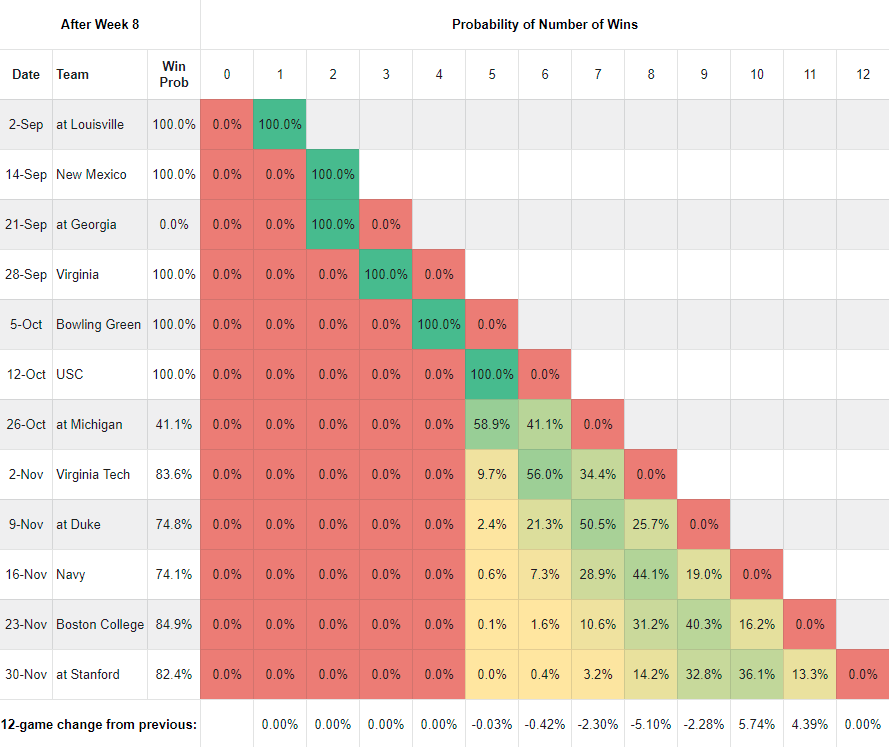
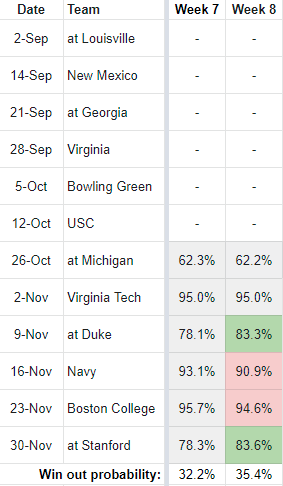
Post-Week 8 Update – SP+
Post-Week 8 Update – FPI
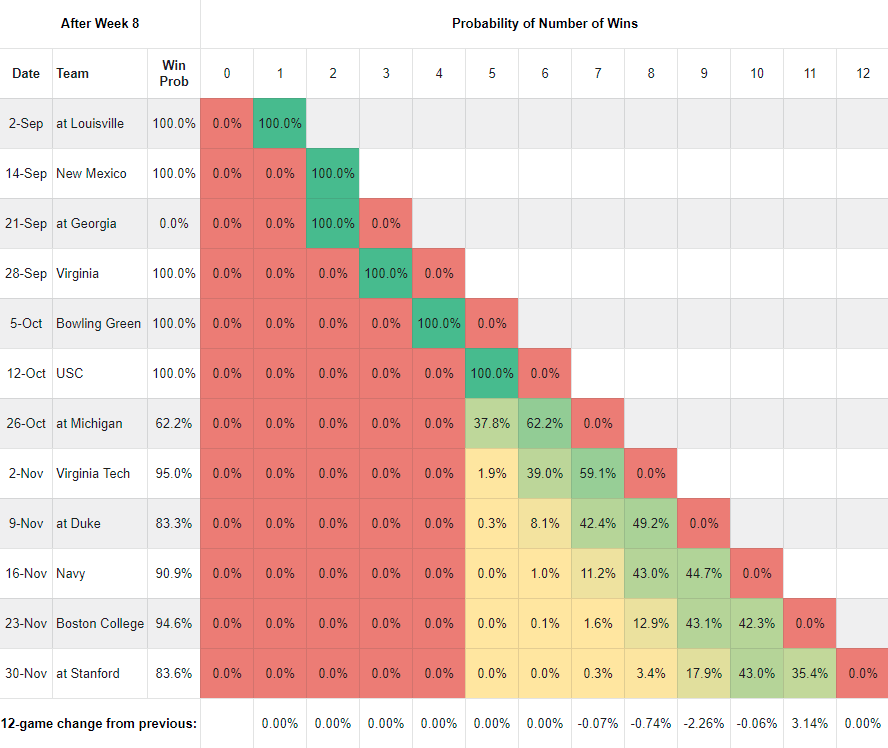
As you move down each column, you find the probability of Notre Dame owning that many wins at that point of the schedule. In the first row, you can see that the probability of owning 0 wins through week 1 is 0% and one win is 100%, since we already won. Same for the New Mexico row, and so on. In the last row, we’re tracking how much the probability of each win total has changed from the previous week. This is largely a function of our own outcomes, the quality of play that led to those outcomes, and SP+’s changing perceptions of our opponents.
The figure at the end of the Stanford row reflects our probability of winning out (in this case, having 11 wins through 12 games). FPI and SP+ obviously have very different pictures of Notre Dame, but the main takeaway here is that the odds of winning out went up in both metrics this week.
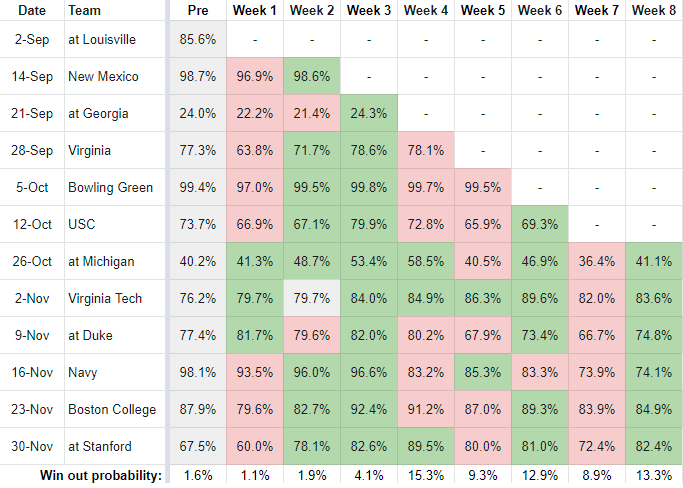
Week by Week Game Trends – SP+
Week by Week Game Trends – FPI
Note that I only just started tracking FPI and I can’t get past data for it, which is why this has so much less information than the SP+ graphic.
Other Nuggets
- Tackling the “Big Three”: With the USC game behind us, SP+ has a Michigan/Stanford split finish as the most likely outcome of the Big Three at 49%, while FPI’s most probable outcome is a sweep at 52%.
- Taking care of business: Notre Dame’s expected win total per SP+ jumped from 9.15 to 9.41, while FPI’s inched upwards from 10.03 to 10.10. If the Irish win all games in which SP+ heavily favors them (70% or higher win probability) that expectation moves up to 10.41, while in FPI it moves to 10.62. The astute among you may have noticed that the fractional segment there is equivalent to the models’ respective projections for the Michigan game, as Notre Dame is a prohibitive favorite in both models in every other remaining game.
- Movers and shakers:
- It’s been quite the wild ride for the SP+ win probability against Michigan.
- It steadily climbed a total of 18 points from preseason to Week 4, when Georgia held off Notre Dame and Wisconsin destroyed Michigan.
- It then dropped all the way back to the preseason number the next week, when Michigan hammered Rutgers and Notre Dame (eventually) strangled Virginia.
- Then it bounced back 6 points the next week, when the Irish hammered Bowling Green and Michigan struggled with Iowa. Turnabout is fair play.
- Then it dropped almost 14 points again when Michigan pulled away from Illinois (who SP+ thinks is terrible) and the Irish staved off USC (who SP+ thinks is decent).
- Finally, it jumped almost five points again when Notre Dame was idle and Michigan lost to Penn State. I hope you like roller coasters.
- The only other real item of note is that the win probabilities against Duke and Stanford went up significantly in both models. Which tends to happen when you play as badly as they do – Duke’s result was noted above, and Stanford lost 34-16 to a really bad UCLA team.
- It’s been quite the wild ride for the SP+ win probability against Michigan.


SP+’s big Michigan blindspot leads me to believe FPI’s outlook is much more realistic/accurate.
Agreed. I said it last week, and I’ll say it again. Michigan isn’t great at anything. Defense is pretty good, offense is pretty not good, special teams are fine.
I’m calling a frustrating evening of manball, with ND pulling away as the game winds on. Our O-line and backs (including a healthy Armstrong) are better than their front 7. Their O-line and backs are not better than our front 7. Forecast is far too many punts on both sides, but eventually wearing them down.
Contrarian counterpoint: ND isn’t great at anything either.
I think the line is correct now: it implies that ND is a marginally better team than Michigan, but the home field advantage makes it more likely than not that UM wins. The one very fun possibility that is in play, though, is if ND scores two quick TDs and breaks their spirit to run away with it, leading to existential dread for the entire Michigan football program.
That is a fun possibility! I do think ND’s defensive front is pretty great though, especially if the opposition offense allows for occasional blitzes. UM doesn’t exactly have USC’s trio of receivers, which leaves a lot more schematic options available for Lea to dial up the pressure. Also, with an extra week to prepare, ND should come in fresh and ready. Expect to see some new stuff on offense with Jones, Armstrong, Kmet, and Tremble simultaneously active for the first time this year. Think jumbo package, with either TE free to whiff on a block and peel out on short routes.
Meanwhile, UM is hanging by a thread, trying to stave off a disaster of a season. The PSU loss was a real kick in the teeth, and the whole world is saying that OSU is an obvious home loss to end the season. That makes 9-3 the best case for a team that expected much better things. They’ll be hungry for sure, but a win on Saturday would have made them MUCH scarier.
FWIW 528 has it at 57% ND and Sagarin has it at 50%. Vegas line opened at Michigan -4 yesterday (guffaw) and has already been bet down to Michigan -1.
That makes me feel worse (given that I have come to think that 528 is wrong more than right <- may not be true, but feels that way). I think if this game goes "chalk" ND wins by a small margin. I think if there's any TO luck, injuries, or bad bounces… that is going to be the deciding factor.
Line is now ND -1. Midweek line accurately predicts SU winner 78% of the time