
Womp womp. I don’t have much of an appetite for witty comments this week – Notre Dame was beaten, and beaten soundly, in every phase of the game in Ann Arbor. Sure, many saw a loss as likely – like SP+, for example – but nobody had any clue that something like that was waiting, and now the Irish program is once again facing an existential crisis. That’s all for other posts, though; head over to Murtaugh’s excellent game recap for that discussion. This one will stay on topic about the math for the rest of the season. Sigh.
Recapping the methodology again: These aren’t actual SP+ win probabilities, as SP+ creator Bill Connelly doesn’t publish those regularly after his preseason previews. We used a slightly tweaked version of the formula that the Reddit guy reverse-engineered to get close to published probabilities. That formula does some probability magic on the differential in SP+ rating for the two teams (with a bump for home field), and voilà.
Post-Week 9 Update – SP+ Matrix
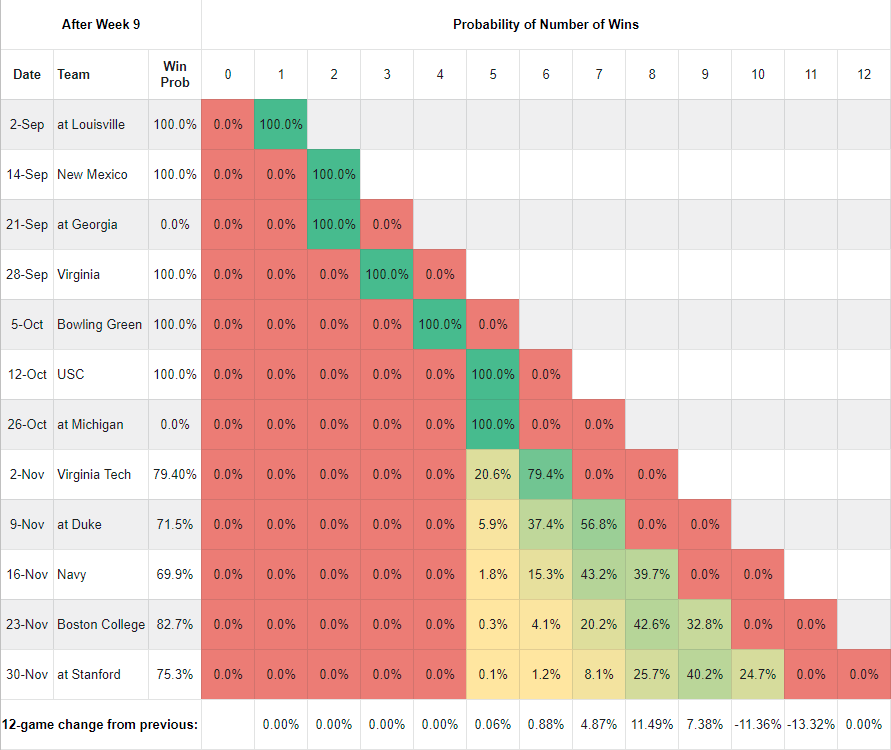
As you move down each column, you find the probability of Notre Dame owning that many wins at that point of the schedule. In the first row, you can see that the probability of owning 0 wins through week 1 is 0% and one win is 100%, since we already won. Same for the New Mexico row, and so on. In the last row, we’re tracking how much the probability of each win total has changed from the previous week. This is largely a function of our own outcomes, the quality of play that led to those outcomes, and SP+’s changing perceptions of our opponents.
The 24.7% figure at the end of the Stanford row reflects our probability of having 11 wins through 12 games – in other words, that’s our probability of winning out. That’s solid, even with just a handful of games left, but it trails 9-3 at 40.2% and, even more troublingly, 8-4 at 25.7%. I know there will be a number of people who will say “I told you so,” but again, that team that took the field in Ann Arbor didn’t remotely resemble the team that came out in the previous six games. Not even the team that took the field in Athens.
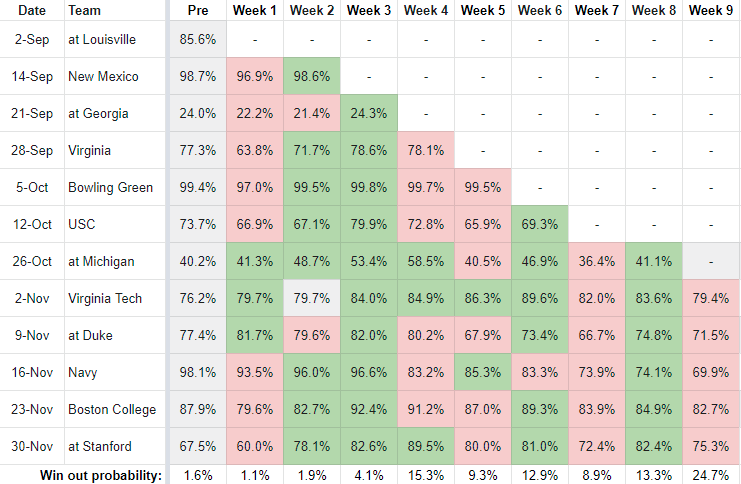
Post-Week 9 Update – FPI

As you can see, FPI is still far more bullish on Notre Dame than SP+ is. Here, 10-2 is the most likely outcome at 44.1% followed by 9-3 at 40.3%, and 8-4 is far behind at 13.5%. It’s hard to square the way the Ann Arbor Irish played with the way the Athens Irish played, and accordingly, it’s hard to know which numbers to believe. There’s an awful lot riding on the team’s performance against a bad Virginia Tech squad this week.
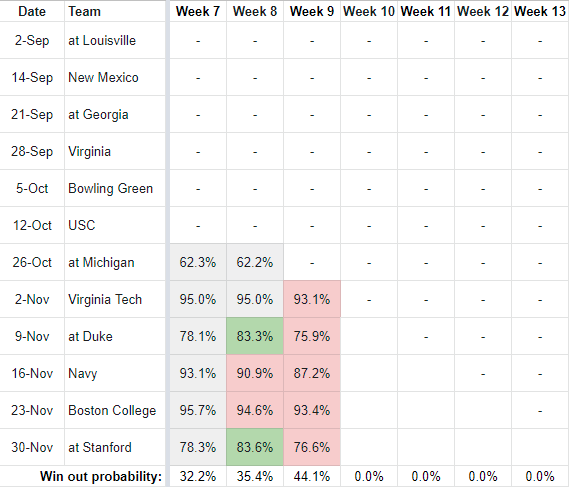
Week by Week Game Trends – SP+
Week by Week Game Trends – FPI
Other Nuggets
- Flopping on the “Big Three”: Initially we defined the “Big Three” as Georgia, Michigan, and Stanford. Post-Georgia, we redefined it as USC, Michigan, and Stanford, just to keep tracking the most high-profile games. Well, we’re guaranteed a negative split at best on the original Big Three, a positive split at best on the revised Big Three, and .500 at best in the four biggest games on the schedule. Here lies the notion of the Big Three. RIP.
- Taking care of business: Notre Dame’s expected win total dipped down to exactly 9.0 in SP+ and to 9.47 in FPI. Both metrics favor the Irish heavily in all remaining games (70%+ win probability), and of course winning out is the only path to a 10-win regular season.
- Movers and shakers: Highlighting just the notable movers…
- The win probabilities for Stanford (-7.1 points), Virginia Tech (-4.2), and Navy (-4.2) were the big movers in SP+. All are still relatively high, but, well, cold comfort at the moment.
- The win probabilities for Duke (-7.4 points) and Stanford (-7.0) were the big movers in FPI, although again all the probabilities are still high and in fact higher than SP+. Perhaps we should all aspire to be higher for the rest of the season. Food for thought.


Maybe we should we have had more faith in SP earlier this year — wasn’t it telling us that Michigan was better and that ND was a bit overrated?
SP+ has had Texas and ND nailed this year as good but not very good.
I don’t think so, cherry picking metrics doesn’t fully account for what happened on Saturday. SP week 7 had Wisconsin at 4 and Missouri at 10, it’s not infallible. These are unpredictable college kids and unpredictable climates and I am so sad this week.
SP+ certainly is fallible, and its attempting to project the average result (if these teams played 100 times), which can always be different than any one result. In theory, it also gets more accurate as the season goes on. That said, my gut reaction when we started tracking FPI because SP+ didn’t “feel right” was that the whole point of computer models is to create a data driven objective standard that can be looked at. If we jump models when we don’t feel the results of one, then we’ve undercut the precise value of a data model.
*I will give Brendan credit, in that he didn’t fully jump models, but brought a second one in for perspective. But it did seem overall that we were dismissing both the SP+ ratings for ND and Mich. And while SP+ didn’t project 45-14, maybe there was SOMETHING to what the model saw that we all dismissed.
The model was correct about the outcome but didn’t really get the “why” right. For instance, SP+ didn’t put a ton of stock in Michigan’s offense (52nd before the game) so it probably would have been hugely surprised that they would be able to run 300 yards on it’s 35th ranked defense.
The model couldn’t have understood like the huge rainstorm that basically took out both passing games, which ended up being much more advantageous for Michigan’s gameplan and in execution since they were able to establish a run and totally neuter the ND offense who quickly fell into a hole and then pressed too hard.
I get what you’re saying about the data models but I think with anything more perspectives is always better to take into account.
Given what I saw this weekend, I tend to think the model would have been more correct w/o the rain.
So yes, a model that doesn’t take into account weather, where weather was a huge factor in game plan/play calling and game flow isn’t going to get those “why”s correct. That doesn’t mean it was actually wrong where we were saying it was going into the matchup.
Also completely agree on more perspectives = better (why I love 247 Composite), but in that case I think we include FEI from the beginning of the season and not just when we don’t like the model we’re using (which gives the feel of “Well… lets just ignore model X and pay attention to Y” rather than “Let’s look at multiple models for a wider perspective”).
For the record… I started this with SP+ because I was basing it on the Reddit guy’s work last year, and added FPI in after some discussions in our 18S writers’ room over how wonky SP+ seemed overall this year. Not because I didn’t like what it was saying about ND, which was generally quite positive aside from its projection for the Michigan game.
Also, its projection for that game was Michigan by 4, so in terms of magnitude it was waaaaaaay off. Not that that means SP+ is bad, rather that nobody’s model saw it coming.
Also also, I like FEI better than FPI, despite FEI liking the Irish somewhat less than FPI. But FEI numbers come out later than I need them to get this out on time, so I use FPI anyway.
I promise I’m not selectively using metrics just because ND is higher in one or the other. This is just the way it worked out.
Absolutely fair. I was not trying to point the finger at you Brendan and more just identify the overall feel both with the timing of adding FPI (which as you say was circumstantial) and the general response from the commentariat that was putting down SP+. I still love that you chose to run these for us this season, and actually like the addition of the FPI overall.
So I haven’t followed VT at all this year but I do see that they’re 5-2. Does anyone else feel that ND -17 is a pretty big line following last week?